| This article is part 2 of a 3-part series on Fracture Mechanics. |
| Part 1 | Part 2 | Part 3 |
Editor's Note: This article is the second in a 3-part series on the application of fracture mechanics in a plant environment. Part 1 provided an introduction to fracture mechanics and its basic principles. This article will take a closer look at the failure assessment diagram or FAD.
Introduction
Every fitness-for-service (FFS) assessment must have a well-defined acceptance criterion. For many damage mechanisms, it’s the “remaining strength factor” (RSF). But for crack-like flaw assessment, it’s the Failure Assessment Diagram, or FAD.
A Quick Review
In the last Fitness-for-Service Forum, published in the September/October 2020 issue of Inspectioneering Journal, I discussed the basics of the FAD and included the diagram reproduced in Figure 1.
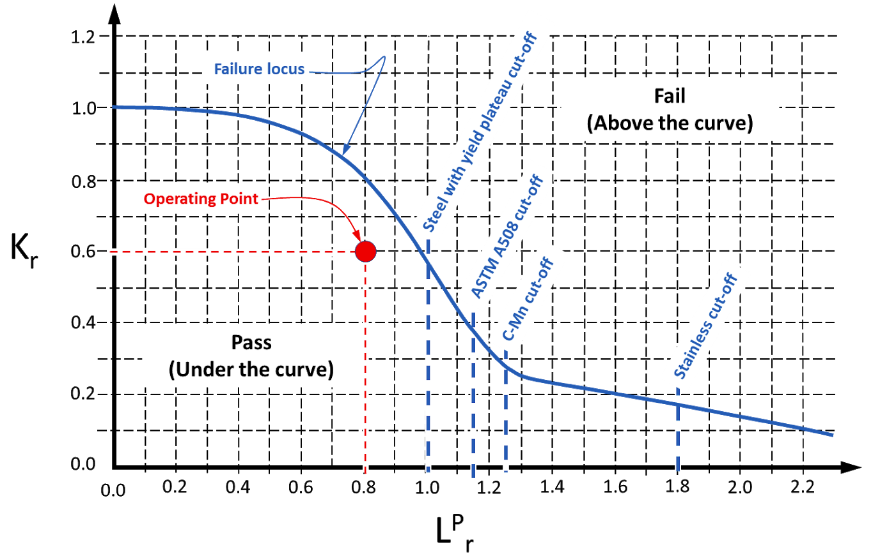
In Figure 1 you can see an “Operating Point” plotted in red. Because the point falls below the “Failure Locus” (the solid blue line), it passes the assessment. You can also note the different “cut-offs” for various materials (vertical dotted lines at the right end of the plot).
The operating point is plotted in terms of two ratios: Lr and Kr, representing a load ratio and a fracture ratio, respectively, and are defined as:
 Eqn. (1)
 Eqn. (2)
Where:
KI = Calculated stress intensity in the material, from both primary and secondary stresses.
KIc = Critical stress intensity (i.e. fracture toughness), a material property.
σP = Calculated reference stress in the material, due to primary stresses.
σys = Yield stress


Comments and Discussion
Add a Comment
Please log in or register to participate in comments and discussions.