With Risk-Based Inspection (RBI), we’ve not only accumulated more data over time but have also gathered better-quality data. This improved data can help us better predict failure, plan inspections in terms of time and coverage, and identify when inspections aren’t necessarily the right solution for mitigation.
However, despite more access to better quality data, there have been many industry-wide debates on whether facilities should use a purely data-driven approach or rely solely on subject matter expertise to predict equipment performance. Some subject matter experts (SME) still struggle to rely on their RBI programs’ data due to either poor data quality or unavailability. Likewise, data analysts can worry about recency bias in SMEs who tend to weigh recent observations more heavily. For example, a pump that recently failed may be judged too conservatively, while a pipe with long remaining life may be ignored altogether.
For facilities to truly get the most out of their RBI programs, a hybrid approach of data and subject matter expertise should be leveraged. We have accomplished this by creating a blended approach of Mechanical Integrity (MI) and data science with Lifetime Variability Curves (LVC) to produce more quantitative capabilities and improve the Probability of Failure (POF) calculations for thinning.
What is the Lifetime Variability Curve (LVC)?
LVC is a probabilistic model that provides a more accurate and precise method of predicting an asset’s POF over time. The LVC is used to model data behavior and dynamically adjusts failure forecasts by identifying and quantifying trends, changes in data states, and uncertainty in key data features and inputs.
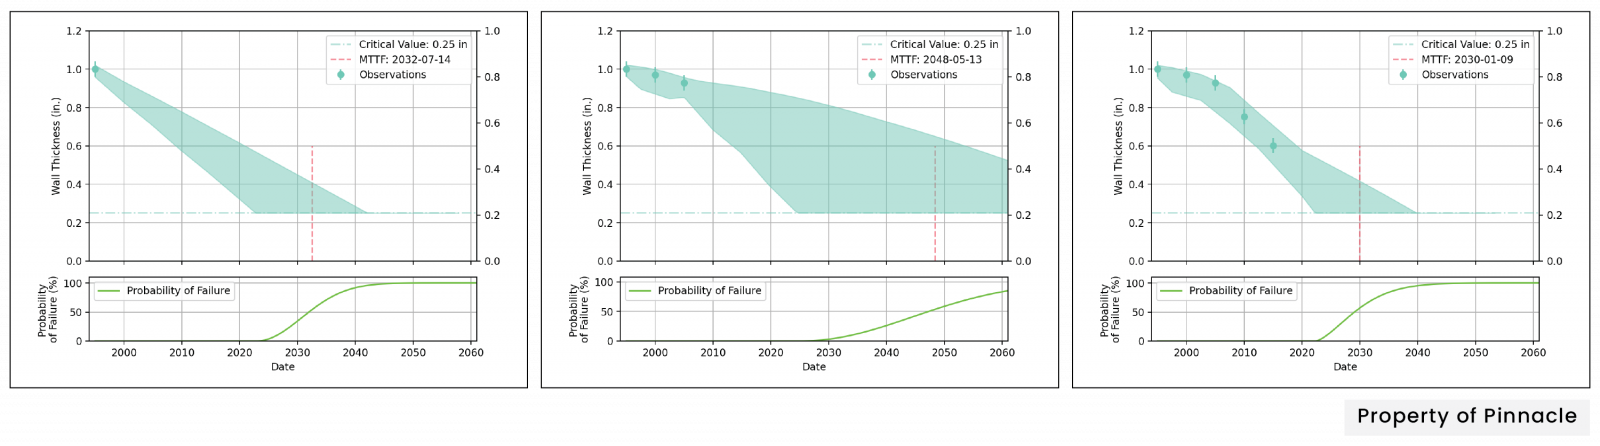
An example of LVC is shown in Figure 1. Visually what you see on an LVC is a double chart. On top, you see thickness data trended over time, and below is the POF. Each node, in blue, represents an individual thickness measurement from historical inspection, providing a range of potential thickness values to account for uncertainty in the actual measurements themselves. Subject matter expectation is accounted for, and the shaded region is developed. As additional thickness measurements are taken, the level of uncertainty begins to reduce, and the range of the shaded region begins to tighten. The critical thickness value is where we anticipate a failure is likely to occur. This correlates with the POF chart below and is how we craft a POF profile.
The LVC uses quantitative data, such as condition monitoring results and other critical reliability data, to project future performance and degradation while quantifying the uncertainty in how said data is behaving. This enables the LVC to calculate the probability of failure for each individual asset, component, and failure mode based on asset-specific data. Ultimately, this will give a more nuanced estimate of when a failure is likely to occur and, therefore, when action should be taken to best mitigate the potential issue.
What are the Applications of an LVC?
The LVC model blends a combination of first principles engineering and data science to create POF and risk projection models for all asset types. LVCs are not as dependent on conservative assumptions and can be applied across various asset types and failure modes including the thinning of fixed equipment, excessive vibration on rotating assets, the functional performance of heat exchangers, and creep damage in furnace tubes. The LVC enables a consistent, dynamic calculation of the POF, risk, and availability for each asset in near-real-time as soon as new information is made available.
What are the Benefits of Leveraging LVCs?
An LVC can help you better quantify POF and expected failure timeframes to optimize your inspection and maintenance activities by:
- Leveraging a POF curve that is refined continuously based on new facility data instead of static POF calculations.
- Providing the knowledge that you are collecting the right data at the right time, helping you justify spending and optimize maintenance activities relative to planned downtimes.
- Avoiding over-collecting data in some areas and under-collecting data in other areas.
For the full webinar, watch Four Ways to Get More from Your RBI Program. For additional application examples, watch this webinar on CML Prioritization leveraging LVCs.
For more information on Lifetime Variability Curves (LVC), visit https://pinnaclereliability.com/learn/topics/what-is-a-lifetime-variability-curve-lvc/


Comments and Discussion
Add a Comment
Please log in or register to participate in comments and discussions.