How much of your reliability data actually adds value to your facility? As the industry continues to collect more and more data, many facility leaders are unable to confidently leverage their data to drive better reliability decisions across their facilities because they do not quantitatively understand the uncertainty of their data and its impact on facility performance. This results in not collecting the correct type or amount of data, which leads to unmanaged and hidden risks. Additionally, facilities more often than not over collect data that adds little value to preventing asset failure, wasting limited resources which could be better utilized elsewhere.
So, how can you use data to better quantify uncertainty and drive smarter reliability decisions at your facility? By leveraging Quantitative Reliability Optimization (QRO). QRO is a new dynamic reliability approach that bridges existing first principles reliability models with new data science, multi-variate analysis and system-based optimization to drive improved facility performance balancing availability, process safety, and spending performance.
There are four elements of QRO:
- Asset Risks Analysis (ARA)
- Lifetime Variability Curve (LVC)
- Forecasting system availability
- Reliability simulation and performance optimization
The first two elements of QRO, ARA and LVC, are the first steps in driving improved performance by bringing together 1st principle-based reliability engineering and data science.
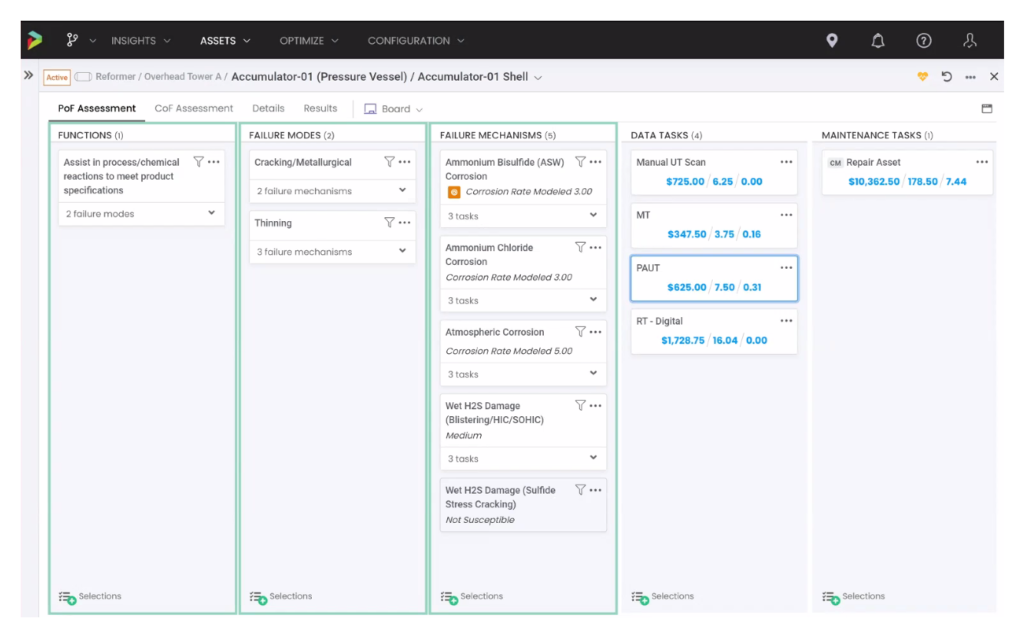
What is an Asset Risk Analysis (ARA)?
ARAs combine current industry leading engineering principles such as RBI and RCM with field execution constraints and task requirements with quantitative data to build the foundational aspects of QRO. ARAs create a cause and effect link between all assets’ functions, failure modes, and failure mechanisms to identify the reliability and maintenance tasks that are needed to mitigate failures. As a result of an ARA implementation, facility leaders will ensure that the foundations of a successful reliability program are in place resulting in immediate streamlining of the deployment of limited resources by focusing on the most critical assets. Most importantly, ARAs ensure each facility has the data infrastructure to be able to take advantage of more complex data science and machine learning analyses across their entire asset base.
ARAs streamline the implementation of a traditional RBI and RCM strategy development process to return value sooner by focusing on components that drive asset failure.
By incorporating ARAs into your reliability strategy, you can:
- Assess all asset types using the same methodology and quantitative results, breaking down siloes in reliability and enabling effective comparison and prioritization of risks and asset management plans across all asset classes.
- Clearly understand causal links between all asset functions, failure modes, failure mechanisms, critical reliability data, and field execution tasks, laying the foundational framework for any successful reliability program.
- Create the framework to understand the benefit to cost of every task for all assets in your facility.
After implementing ARAs into your program, the next step is to begin to leverage data science principles with the Lifetime Variability Curve (LVC) to understand the confidence in your data.
What is a Lifetime Variability Curve (LVC)?
LVCs are dynamic models that predict asset failure through the application of data science principles. Similar to a hurricane tracker, as more data points are collected, the model quantitatively updates and provides a statistical distribution that becomes more accurate as more data is entered. This statistical distribution can then be measured to understand the level of uncertainty around any component and asset.
The below image is an example of thickness data for a pipe. In the far-left view, a single data point has been plotted along with its projected band of uncertainty. This band of uncertainty is generated from the initial baseline model comprised of a first principles engineering analysis considering current process operating conditions and subject matter expertise. Next, the LVC model converts the statistical distribution of the uncertainty band and converts this into a probability of failure (POF) curve. Essentially, allowing you to know the likelihood of failure with a quantified measure of confidence.
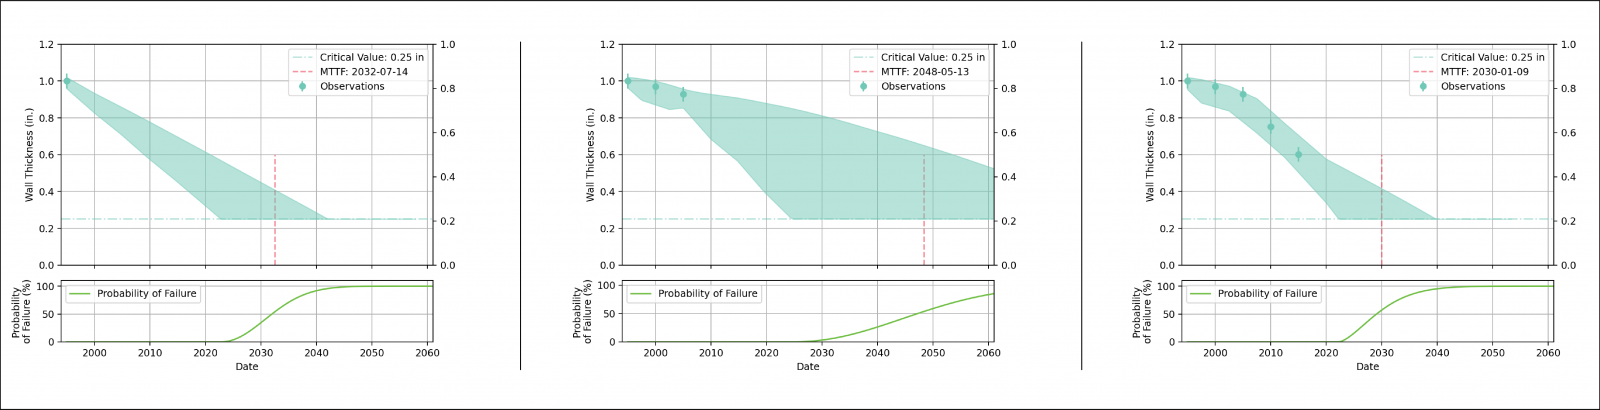
As more thickness data enters the model and process operating conditions change, the shape and distribution of the band changes. The model dynamically adjusts based on new input data and the POF curve moves. While the region of uncertainty initially grows in the second model, this increase is a result of the measured data differing from the initial 1st principles baseline and subject matter prediction. As additional data points are added (far-right figure), the band of uncertainty shrinks as more confidence is placed on the measured data and a tighter prediction is shown.
LVCs can be applied to other types of data as well including condition monitoring data such as vibration, or other process parameters to indicate functional failure such as fouling. LVCs provide a quantitative approach to understanding how process data, all other measured data, and subject matter expertise impact the statistical distribution of probability of failure for every asset type.
Conclusion
Implementing ARAs at your facility will ensure you have the foundational elements of a reliability program for every asset type in place across your facility. Many facilities have already begun this journey, so an ARA implementation will close any remaining gaps and ensure this foundation is built to incorporate more complex analysis such as machine learning and artificial intelligence across every asset type. Once the ARA foundation is built, whether you have data or don’t, an LVC will allow you to measure the uncertainty and confidence on the probability of failure for every asset. Incorporating data science principles, LVCs can immediately drive better reliability decision making by quickly identifying non-value add tasks that do not impact the uncertainty around an asset’s failure. Completing the first an ARA and LVC, is the first step in QRO and realizing the next revolution in reliability modeling. For more information on the elements of QRO and how you can apply them to your facility, review Pinnacle’s QRO video series.


Comments and Discussion
Add a Comment
Please log in or register to participate in comments and discussions.