In my travels around the world as one of the primary API RBI 580/581 training course instructors the question always comes up, “What risk threshold or tolerable risk should I be using?” and “If I do not have one, how can I implement RBI?”
The answer is, in most places no one outside the owner operator organization will set one. This is up to the owner operator to set.
But let’s back up a little. As most readers know, my primary basis for discussing RBI is the API RBI Base Resource Document 581 technology. In these cases when one performs their initial RBI implementation, data is entered for both the probability of failure and consequence sides of the risk equation.
PoF + CoF = RISK
In calculating the PoF (probability of failure) portion the following are considered:
Generic failure frequency X Damage factor X Management factor = PoF
Generic failure frequency (Gff) – Observed average failure rates, in failures per year, for various types of equipment, e.g. column tops, overhead drums, drums, column bottoms, etc. For example, a commonly reported rate for pressure vessels is 1 X 10⁻⁴ or 1 in 10,000 years.
Damage factor (DF) – A factor of adjustment to the Gff representing your particular piece of equipment with all the credits and debits it deserves considering, for example:
- Materials of construction (and their resistance to damage – see the following)
- Reasonably expected damage types, past, current and future
- Damage rates or susceptibilities
- Thickness
- Inspection histories and their effectiveness for each potential damage type
- Numbers of inspection for each damage type • Corrosion allowance
- T-min
- Cladding considerations
- Pressures and temperatures
Management factor (MF) – A factor derived from a questionnaire meant to indicate management’s true commitment to the fixed equipment reliability program.
This background is provided to substantiate the following observation. Once one has entered the required CoF and LoF information for a piece of equipment, this will indicate the current risk level, once one has clicked the “calculate” button. This risk represents all historical information including inspection, corrosion and materials and operations activities to that point. So no hand wringing to this point.
Now I have my starting point and an understanding of the risks I have been working with to this point. From this metric I can choose to let risk “float” upward, “push” it downward or try to maintain the same risk level for the period desired. Risk is dynamic, so it will change over time.
Don’t get hung up on letting risk “float” upward. There are pieces of equipment that are extremely low risk threats in your plant that you are over inspecting. Don’t you think you should identify them and move some of those resources to the high risk equipment, some of which you have not identified yet because you have not done RBI yet, because you are caught up in the paralysis of the acceptable risk question, to drive their risks downward?
When you begin to understand these relationships, and if you are deriving true PoF numbers as part of your RBI analysis, such as 1.26 X 10-3.7, you can begin to consider how reliability is impacted by aging equipment and/or process changes such as planned debottlenecking, expansions or changes in units such as from a hydrocracker to a hydrotreating unit. This allows operators to strategize proactively, optimally. Keep in mind, you are managing thousand of pieces of equipment and with the use of computing power it is made quite manageable.
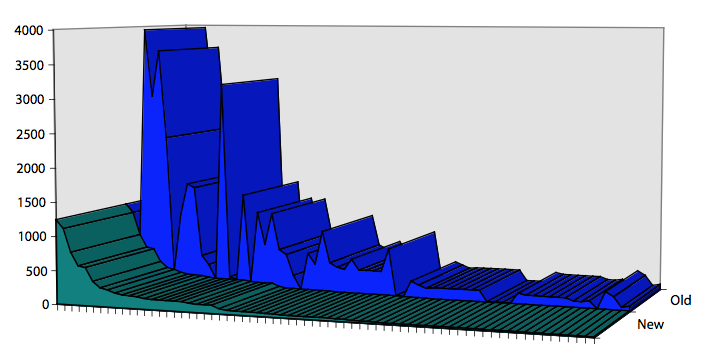
Here is a graph illustrating a few key points:
- The graph represents the 100 top risk items in a real process plant unit
- The “Y” axis risk in sq’/year or more simply relative risk metrics (based on health & safety consequences).
- Equipment is on the “X” axis
- The blue plot (background) represents cumulative risk for each piece of equipment from the time the RBI study was implemented through the next turnaround, 4 years later, if they continue with business as usual, in other words a traditional API 510/570 inspection strategy (Note the areas of vulnerability, or spikes in this plot. While some represent inherent risk, many were driven by manageable PoF activities as shown in the foreground plot.)
- The green plot (foreground) represents cumulative risk for each piece of equipment from through the same 4 year period if the API RBI strategy is implemented, through the turnaround. This includes taking the risk accumulated historically up to the time of the first RBI analysis during implementation. (Note the “spikes” that have been smoothed, or where risk has been mitigated by implementing the RBI plan.)
- It should also be noted that costs for implementing each plan were compared to the amount of commensurate risk reduction and that a 39% improvement in ROI was achieved by implementing the RBI plan, i.e. the traditional plan yielded 1.7 sq’/year of risk reduction per dollar spent. The RBI plan yielded 2.7 sq’/year or risk reduction per dollar spent.
- There was also a substantial amount of non-value adding work that was being done that was reallocated to other areas to achieve a more effective ROI for equipment reliability.
The following table, listing typical refinery units illustrates the same tale:
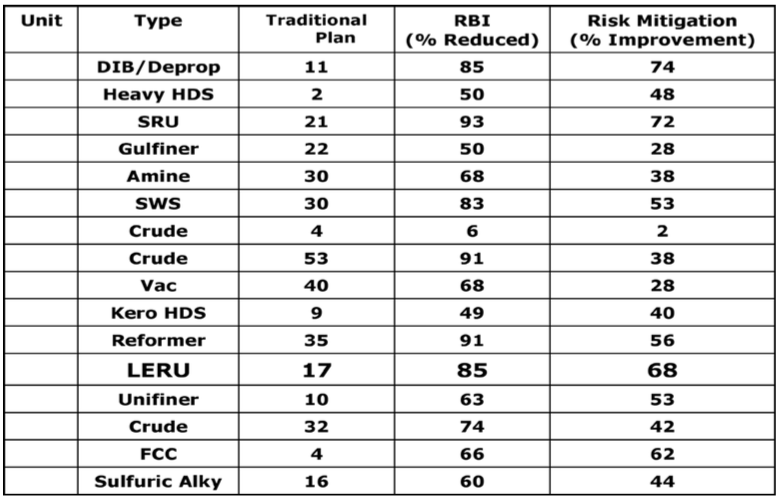
In the many cases shown in this editorial it is obvious that we can do a lot to improve risk management effectiveness and efficiency without being paralyzed by this very important question that only each operator can answer for him or herself that is the title of this editorial. We can see where we are, understand how we got to where we are and move forward with our eyes wide open. We can choose to stay at the same risk level or improve. We can identify our areas of vulnerability and manage them appropriately. We can identify areas of non-value adding activities and shift those resources to improve reliability and drive risk down.
It is still an important question, though, and one that should not paralyze us in getting started on the RBI journey, but one to provide further improvement in our reliability programs once we have determined what reasonable metrics to use and what course to follow in our continuous improvement process. In the meantime we can still manage our business effectively with available metrics. As always I must point out that in order to have an effective RBI program one must (This is by no means everything. Look at API RP 580 for more and follow your jurisdictional rules in any case.):
- Ensure a good damage mechanisms review is done by an industry and hopefully unit corrosion engineer that is highly experienced. This is key to a good RBI program and can make up for other weaknesses.
- Get operations engaged, fully, to assure conditions are being considered accurately, this includes intermittent operations, upsets, shutdowns and startups, injection point practices for corrosion control, and those trace amounts of chemicals that can lead to premature equipment failure, etc.
- Especially if using a “qualitative” RBI tool or software, make sure that every effort possible is taken to ensure consistency of all studies at all times. This is relative risk. If we lose consistency it is a waste of time and perhaps hazardous. Develop an effective, detailed procedure and provide leadership and facilitation where everyone is “on the same page”.
See the news article in this journal entitled, “API RBI Software User Group to Host Roundtable on Risk Targets”.


Comments and Discussion
There are no comments yet.
Add a Comment
Please log in or register to participate in comments and discussions.