Stephen Covey, author of The 7 Habits of Highly Effective People1, provides a lot of good advice for leaders. For example:
Begin with the end in mind
First things first
First focus on being effective, then efficient; otherwise we may just be doing the wrong thing faster
You may be thinking to yourself: “How does this apply to me? I am not in a leadership role. My company does not lead the way, we satisfy a defined need within our industry.” If this, or some variant of, is what you are thinking, I challenge you to think again. Leading is something done at the beginning of the journey. Every time we step in to a new role, explore unfamiliar territory, or challenge those around us, however simple or complicated the situation may have been, we are crossing areas that others have yet to go. In essence, leading the way. If asked to think about what leadership roles you have played in your life, some will be obvious, e.g. father, mother, uncle, aunt, etc. While you may not be a manager within your organization, leading is not limited to management. Leadership includes the start of new initiatives at your facilities, or the re-launch of the same, for example:
- New Risk-based Inspection initiatives, some primary tools for helping you:
- Identify and relatively measure risks
- Identify the risk drivers and their contributions to risk, and for the sake of this article,
- Identify what are causing the uncertainties, and
- Measure the impact of those uncertainties on the risk, and how
- New CUI (corrosion under insulation) programs
- New coatings programs
- New programs for equipment remnant life
- New IOW (integrity operating windows) programs
- Etc.
The various factors of the challenge, e.g. creating effective and then efficient inspection strategies, are at the crux of the decision process. Within each of these factors are questions that must be answered. The answers should be well thought through and provided as part of your risk-based inspection analysis process. These questions include:
- How accurate does your data and damage assessment need to be? Or asked another way, how much uncertainty is acceptible?
- How much and what type of inspection information do you need to reduce the uncertainty to an acceptable amount? This must come from the results of strategy implementation.
- When is the risk of leak/failure unacceptable? Keep in mind, risk is dynamic and your equipment experiences various damage rates at different times. In addition, failure of said equipment may result in various and different consequences, at different times. For example, financial consequence may be dependent upon market demand, knock-on effects, etc.
- How can you use risk assessment to ensure your RBI process answers these questions?
So, as part of your RBI process and prior to making inspection strategy decisions, it is important to ask yourself the following questions (after all, money and time are not in infinite supply):
- What damage mechanism(s) are you looking for?
- What is the starting or current state of your equipment condition?
- How quickly is damage expected to progress?
- How predictable are future operating conditions?
- Are triggers (e.g. IOWs, notifications, etc.) in place that will alert you to unanticipated process changes?
- If damage is present, how long can it exist before it will cause your equipment to leak or fail?
- When should you inspect?
- Is proactive FFS (i.e. engineering critical assessment (ECA), justified so you can determine minimum tolerable/critical flaw sizes and critical areas) needed/justified for you to determine required NDE sensitivity?
- I recommend using RBI to determine/measure when this is justified, based on risk ROI, i.e. how much having and using this information can reduce uncertainty. Many owner-operators already employ this practice for certain critical units/equipment such as hydrocracker reactors. Another benefit of such an assessment is to help in making critical run/repair/replace decisions, quickly, during turnarounds by using the failure assessment diagrams (FADs) produced in such exercises. FADs show tolerable flaw sizes, lengths, and depths. Remember, anticipated time to an unacceptable state is always part of this assessment.
- If a formal ECA is not justified, you should have some idea of:
- The failure mode, e.g. brittle fracture, ductile tear, leak before break, pinhole leak, fish-mouth tear or fracture, fatigue crack, etc.
- If damage or an anomaly is present, below the detectability limits of the inspection strategy, will the equipment make it safely and reliably to the next scheduled inspection time, considering the anticipated stresses and damage rates?
- What is the impact of your inspector/NDE operator performance?
- This factors qualification demonstration testing into the probability of failure (POF) calculation via inspection effectiveness credits.
- What NDE methods should you use?
- Will the NDE find what you need to find?
- What complimentary inspection/NDE do you need to perform, if any?
- Where (thinking in 3 dimensions) should you inspect?
- How much area should you inspect?
- What are the strategy implementation costs, and the return on investment for the various strategy options?
It is important when designing a fixed equipment reliability program, of which inspection is a part, that we ask ourselves, “Why do we inspect equipment in oil and gas producing, refining, petrochemical, chemical, pipelines, mid-stream gas and terminals facilities?” There are many reasons. Consider these examples:
- Metal loss can signal a potential effect in contamination of product purity, e.g. unwanted Fe ions and/or rust may contaminate the product.
- Regulators/regulations require it.
- Insurers require it.
- And most commonly, to “fine tune” the reliability prediction. In other words, to confirm the degradation rate so actions can be taken to insure, as best we can, that negative events are avoided and that reliability and availability targets are achieved.
Most basically, though we inspect (which costs money, takes time, and incurs risks of its own) to obtain information to “fine tune” the reliability prediction. Why? We get this additional information for health and safety, business, environmental reasons, so we don’t incur a leak that will shut the unit down or that could lead to a catastrophic event, potentially injuring people, damaging the environment, and to optimize total cost of ownership for our equipment. When we need to, we are collecting more data to know, to an “appropriate” level of accuracy, the true damage state of the equipment. This empowers us to manage equipment integrity better than we have in the past.
How much inspection and accuracy of knowledge of the true damage state is enough? When is it not enough? How do we design an inspection strategy to provide the “right” amount of information to produce the “right” amount of knowledge? These are some questions I hope to answer to your satisfaction in this article.
Sometimes we need to know, as accurately as possible, the true damage state, especially for critical equipment nearing end of life or that has been exposed to a deleterious process excursion, for example, that could have accelerated degradation (a good integrity operating window trigger would catch these instances) which could lead to premature failure of the equipment.
A Historical Perspective and Current Challenges
In the “old days” inspection programs were designed as a “hit or miss” activity. In general, during continuous run operations, we inspected pressure vessels and piping every 3 years. In batch run operations, we often inspected more often (especially for fragile equipment such as glass lined, rubber lined equipment, etc. Equipment that had extremely high corrosion rates where substrate exposure to the process media would lead to quick leaks/failure), and hoped to catch potential problem areas before they failed. Hopefully, we found a potential problem before it resulted in a leak or worse.
The next stage of inspection program evolution was condition based monitoring. At this stage, we were calculating corrosion rates and thinking about damage progression, damage morphology, etc. This was better than before. We let the answers to these questions dictate the time to next inspection. This could be thought of as failure avoidance at all costs, because consequences of failure were not yet factored into the decision making process.
Condition based monitoring was followed by RBI. One of the primary advantages of a well implemented RBI program is that the following key question is answered: “How much confidence do I need to have in what I believe to be the condition of the equipment?”. Relative risk values and other triggers can/will tell you when more information is needed, i.e. when the current or future level of uncertainty is acceptable/unacceptable. The answers should be evident and the risk drivers clearly identifiable. How accurate do you need to be about what you believe to be the condition of the equipment? How much uncertainty is acceptable?
Relative risk can dictate this, as well as the other elements of the relative risk equation (e.g. damage factors, a sub-factor of the POF in the API RP 581(2) RBI methodology); Consequence * POF = Risk. For example, sub-factors of which the POF value is comprised in API RBI RP 581, are the damage factors, which can be used as triggers and as metrics. The owner-operators’ strategy for managing equipment reliability, safety, and integrity would dictate how the triggers are used.
Read Related Articles
Other defined criteria, such as health and safety consequences, financial consequences, environmental impact, and inherent risks should be considered as appropriate, as in keeping with your company strategies, regulatory, and insurer requirements.
Risk Threshold as an Action Trigger and Other Criteria
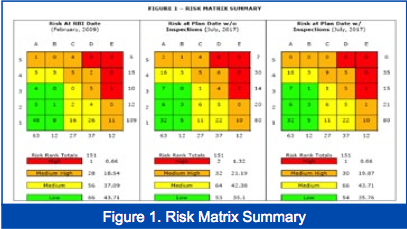
As an example, in API RP 581, various triggers are available as mentioned above and we will review the basis for some of them. For nearly all RBI methodologies, RBI risks are usually calculated and depicted as an initial risk or starting risk and risk at some future point in time. In order to do the future planning, assumptions about future operating practices or conditions must be factored into the analysis. Risk at the analysis date and risk at some future date (Plan Date), are considered risk “snapshots” at specific dates. When risk levels or other triggers such as damage factors, etc. dictate your situation, mitigation strategies are recommended to lower the calculated relative risk value, or damage factor value, etc. Inspections must be performed prior to certain dates where regulations require regardless of RBI results to stay in compliance. As an aside, it should be noted that technologies do exist, which show relative risk escalation over time versus only “snapshots” in time.
Risk values are usually presented as:
- Positions in a matrix
- Risk in area per year (frequency of occurrence)
- Risk in monetary units per year (frequency of occurrence)
Risk Matrix
A qualitative view of the relative risks of the equipment as depicted in a matrix. The matrix may be any combination of cells. The API RP 581 matrix is a 5 X 5 matrix with consequence modeled on the “X” axis and likelihood of failure depicted on the “Y” axis. There are various matrices used throughout the industry.
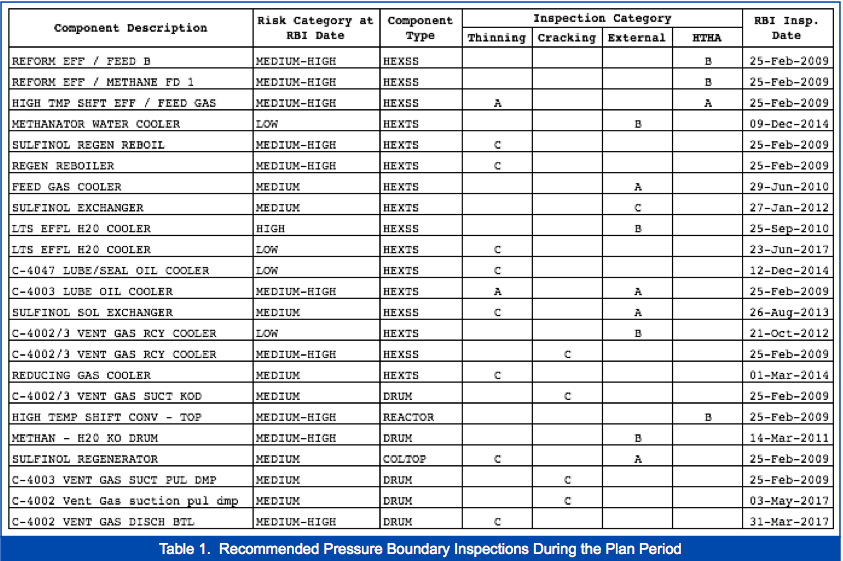
Managing Uncertainty Via Inspection Effectiveness
Table 1 on the previous page shows a listing of target dates which serve as inspection triggers. Typically, the trigger, which is explained in the next section, is the risk threshold, although it may be other defined criteria, e.g. date the equipment reaches a particular damage factor or state/condition, and/or a regulatory or insurer required date. They are in the column labeled “RBI Inspection Date”. Note that the damage mechanisms in question are shown. The level of inspection required to keep risks within manageable limits are also shown as A, B, C, D. API RP 581 Second Edition provides explanations and guidelines for interpreting A, B, C, and D levels of inspection effectiveness.
Rules for interpreting the various levels of inspection effectiveness from API RP 581 Second Edition are:
- A (Highly Effective): The inspection methods will correctly identify the true damage state in nearly every case (or 80–100% confidence).
- B (Usually Effective): The inspection methods will correctly identify the true damage state most of the time (or 60–80% confidence).
- C (Fairly Effective): The inspection methods will correctly identify the true damage state about half of the time (or 40–60% confidence).
- D (Poorly Effective): The inspection methods will provide little information to correctly identify the true damage state (or 20–40% confidence).
- E (Ineffective): The inspection method will provide no or almost no information that will correctly identify the true damage state and are considered ineffective for detecting the specific damage mechanism (less than 20% confidence).
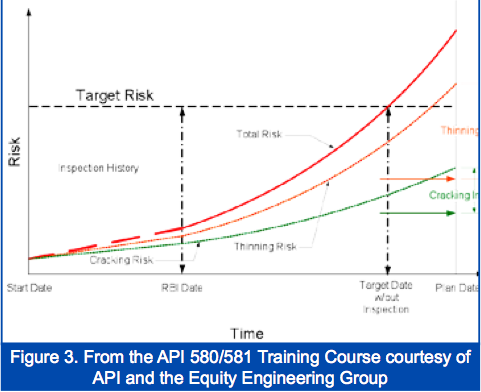
Now look at Table 1 and Figures 2 and 3, with the grading information above in mind. Can you see how risk directs the RBI strategist in selecting an inspection strategy to reduce the uncertainty about the true damage state of the equipment to an acceptable amount?

Risk Threshold as a Trigger
The risk model shown in Figure 2, to the right, shows the following for this overhead drum:
- Risk in square feet per year on the Y axis
- The time-frame covered by the RBI analysis on the X axis is 10 years; the plan period.
- Risk threshold of 35 square feet per year as shown by the red horizontal line.
- The Target Date shown by the red vertical line, is created when the risk for this component or item reaches the risk threshold. This “trigger” means that an inspection or other risk mitigation activity needs to be performed on or before the date the risk hits the 35 square feet per year risk threshold.
- The dark green line represents the overall, cumulative risk for this item.
- The light green line represents the isolated risk contributed by HIC/SOHIC (hydrogen induced cracking/stress oriented hydrogen induced cracking).
- The yellow line represents the isolated risk contributed by CUI (corrosion under insulation). Note that the risk impact of the HIC/SOHIC is greater, sooner than that of CUI corrosion.
- The blue line represents the isolated risk contributed by internal, general thinning. Note that the risk impact of the HIC/SOHIC increases earlier than that of the internal, generalized corrosion.
- Note that an inspection for HIC/SOHIC is recommended to lower the risk to an acceptable level on or before the Target Date. This is a trigger date for action.
Explanation of Risk in Area2/Year as a Relative Metric
These metrics provide more discrimination between items in a risk analysis than position in a matrix cell, which can vary by orders of magnitude.
Let’s start with some justification for calculating/assigning frequency, per year, of events as part of a API RP 580 directed RBI program. The references are from API RP 5803:
4.1.28 Probability
Extent to which an event is likely to occur within the time frame under consideration. The mathematical definition of probability is “a real number in the scale 0 to 1 attached to a random event.” Probability can be related to a long-run relative frequency of occurrence or to a degree of belief that an event will occur. For a high degree of belief, the probability is near one (1). Frequency rather than probability may be used in describing risk. Degrees of belief about probability can be chosen as classes or ranks like “rare/unlikely/moderate/likely/almost certain” or “incredible/improbable/remote/occasional/probable/frequent.”
10.2 Units of Measure in the POF Analysis
POF is typically expressed in terms of frequency. Frequency is expressed as a number of events occurring during a specific time frame. For probability analysis, the time frame is typically expressed as a fixed interval (e.g. one year) and the frequency is expressed as events per interval (e.g. 0.0002 failures per year). The time frame may also be expressed as an occasion (e.g. one run length) and the frequency would be events per occasion (e.g. 0.03 failures per run). For a qualitative analysis, the POF may be categorized (e.g. high, medium and low, or one through five). However, even in this case, it is appropriate to associate an event frequency with each probability category to provide guidance to the individuals who are responsible for determining the probability. If this is done, the change from one category to the next could be one or more orders of magnitude or other appropriate demarcations that will provide adequate discrimination.
As one might surmise, in a risk analysis, we must have a calculation for considering frequency of events. We also must have a calculated consequence of failure. Notionally the relationship is:
*Consequence of failure/frequency of failure = risk metric. Various options exist, depending upon the consequence basis, for example:
Monetary units (e.g. Dollars/year)
Health and safety (area/year)
Example scenario:
- A processing tower containing hydrocarbons and H2S gas (poisonous or toxic).
- RBI analysis done looking at a 10 year plan period or window.
- Consequence dispersion modeling shows that in the event of failure or leak the following are the probable consequences:
- Flammable effects injury/fatality area/perimeter is 5000 sq. feet of radiation area where threshold heat exposure areas are at or above defined injury/fatality criteria.
- Equipment damage area is 1000 sq. feet of radiation area where threshold heat exposure areas are at or above defined damage criteria.
- Toxic effects injury/fatality area/perimeter is 10,000 sq. feet of radiation area where threshold toxic exposure areas are at or above defined injury/fatality criteria.
- Pressure wave effects injury/fatality area/perimeter is 4,000 sq. feet of pressure wave area where threshold pressure exposure areas are at or above defined injury/fatality criteria.
- Pressure wave effects equipment damage area/perimeter is 5,000 sq. feet of pressure wave area where threshold pressure exposure areas are at or above defined injury/fatality criteria.
- At the time of the RBI analysis, when the equipment was new, the POF is 1.0 X 10⁻⁶ or one failure or leak in 1,000,000 (one million) years.
- At the end of the plan period, i.e. without any inspection or any other risk or POF mitigation done, the POF escalates, due to equipment degradation, the probability of failure increases two orders of magnitude to 1.0 X 10⁻⁴ or one failure or leak in 10,000 years.
None of the health and safety or equipment damage area consequence related parameters are anticipated to change over the 10 year Plan Period. Therefore, the consequence scenarios do not change. Typically, RBI practitioners will use health and safety consequences or default to the highest/most conservative consequence outcome scenario. We will do that for this example and use the 10,000 sq. feet of toxic area consequence.
Factoring consequence into our equation, A and B above can be expressed by the following equations, averaging the area risk over the POF frequency time period:
- 10,000 sq. feet / 1,000,000 years = 0.01 sq. feet per year of relative risk exposure.
- 10,000 sq. feet / 10,000 years = 1 sq. feet per year of relative risk exposure.
Similarly, one can perform the same calculation to create monetary risk metrics, e.g. dollars per year of risk. Obviously, due to market changes, the financial risk will change over 10 years. For the sake of this example we will keep financial risk as a constant over 10 years.
- $10,000 / 1,000,000 years = $ 0.01 per year of relative financial risk.
- $10,000 / 10,000 years = $1 per year of relative financial risk.
I hope this primer article helps explain how:
- To understand uncertainty about equipment condition.
- To use inspection to reduce uncertainty.
- To use RBI analysis to understand and create the best strategy to manage and/or decrease uncertainty.
- Inspection can be used to decrease the amount of uncertainty in knowledge about the true damage state of equipment. Risk thresholds can be used as an action trigger to reduce uncertainty.
- Risk analysis can be used to guide the RBI analyst and equipment inspection strategist to the various options and level of inspection effectiveness to employ in order to best manage risk and uncertainty about the true condition of the equipment.
- To create an effective inspection strategy.
- To justify your strategy by using risk metrics.
In the next article on Scalable Accuracy I will cover the use of damage factors or damage state as an action trigger.
References
- 7 Habits of Highly Effective People, Stephen R. Covey
- Risk Based Inspection Technology - API Recommended Practice 581 Second Edition
- API Recommended Practice 580 Second Edition


Comments and Discussion
Add a Comment
Please log in or register to participate in comments and discussions.