Two technologies, immediately available to plant operators for fixed equipment life-cycle management are Risk-Based Inspection4 (RBI) and Fitness for Service5 (FFS), two best practices that optimally work together or can standalone. Both have abilities of scalable accuracy. The accuracy is scalable from more qualitative modeling, with debits built-in for lack of information (scatter in the prediction) and erring to the conservative, producing higher risks or more conservative results, to more quantitative, more data, more modeling, based on risk and proximity to potential end of life producing more accurate results with less scatter in the prediction. Please keep this important fact in mind, technology is only one part of the process, having the “right” people engaged at the “right” junctures in the work process are equally, if not more important. The FFS5 standard mentioned above addresses the qualifications of FFS practitioners and API RBI RP 580, 2nd Edition, November 2009, provides guidance on RBI team members and their qualifications.
Whether the market conditions are favorable or not, equipment reliability is often important for health and safety, environmental and business success. Notice I said “often” and not always. Why? There are many times when reliability at all costs does not make sense, the criteria, whether stated or not, is “fluid”. Hence the need for effective Equipment Life- Cycle Management (LCM) practices, programs and policies. The risk and business worlds are dynamic, not static, as demonstrated by the spinning, not static, swiss cheese model as illustrated in API RP 7543. So it is time for a real change and for owner operator management to be committed to effective change. “The significant problems we face cannot be solved from the same level of thinking at which they were created”, Albert Einstein. So how do we manage 10’s of thousands of pieces of equipment, especially complex piping systems, in a dynamically, changing environment, effectively?
Doing a good job of due diligence is important to achieve maximum effectiveness. Keep in mind that identifying the right people to steward these processes, and identification of effective technologies and work practices are more important at the outset than finding efficient ones. If we are not doing the “right” things and are being highly efficient, we may just be doing the “wrong” things faster. So often we place efficiency at the forefront instead of effectiveness. After performing your due diligence, try piloting a new approach first to achieve effective results then work on maximizing the efficiency of the work process.
While Pareto works well in nearly all cases, i.e. a small percentage (e.g. 10 to 20%) of equipment contributes the vast majority of risk, 80%+, there are units which, while still following this principle, are inherently more risky than others. You will see this in the overall risk comparison from unit to unit, for instance, you may see a lower risk in general for a merox unit compared to an HF alkylation unit.
Let’s face it;
- Most operators do not have unlimited funds for equipment inspection.
- Most operators do care about safety and reliability of equipment.
- It is vital that we do (inspection, FFS, repair, replace, re-validate information, consider operating conditions, changes, operating practices) the right things, at the right times, to the right equipment, in the right locations.
- Many operators’ staffing levels are spread thin, people are very busy and effective prioritization is important
- The lead inspectors’ jobs have changed over the last 20 years or so. Many do less analysis and more management of resources.
- Depending upon the company/site culture, inspectors and materials engineers are often pressed to drop equipment from the recommendations lists.
- Margins on many refinery and petrochemical products are tight and reliable operations are very important to eke out as much product as they can to show a profit or minimize losses.
- Margins on some products are high and therefore, once again, reliability is very important to capitalize on favorable market prices.
- Knowledge is king, but not at all costs. It is situation, i.e. risk dependent.
- Risk is dynamic, constantly changing
- Operating conditions, that can affect equipment integrity, often change.
- The Deep Water, The Gulf Oil Disaster and the Future of Off Shore Drilling, Report to the President, January 20112 stresses the importance of using good risk models and shows what can happen when deficient risk models are employed
There are solutions for the “significant problems” above. I will put a few forward in this article. Our first task is changing the way we look (paradigm) at work, and then demonstrating the value of very useful technologies we have at our disposal. It is important that we show true lasting value to management and that it be credible, in order to sustain the changes and benefits these new technological work processes present. We must make the change, improvements “worth it”, i.e. worth the change in order for the organization to have the motivation to sustain the change. It is important not to fall back into ineffective practices. Once we prove their worth, justification for the other elements to sustain the change should be evident. Other elements include defined work processes (this will come after learning via the pilot).
The Scalable Accuracy Approach to Fixed Equipment LCM
- Using a single RBI software platform (or multiple platforms that have been calibrated against one another) start more qualitatively then progress to semi- quantitative, and quantitative (FFS, QRA, creep remnant life analysis, complex vibration/fatigue analysis, etc.) tools as justified by risk:
- Highest level risk analyses sometimes involve a procedure where multiple pieces of equipment are represented by a single item. One should have a procedure to assure consistency and vet the decisions via qualified team members. This is a very coarse analysis, relatively, and not typically recommended.
- Perform the initial RBI analysis, including damage mechanisms review from the PFD level, or some commensurate level, less detailed than P&ID level. As agreed to by qualified team members use and document assumptions. Qualitative to semi-quantitative
- As risk dictates, get more information to reduce the scatter in the RBI prediction or analysis for those specific higher items, e.g. if the risk driver is an assumed value (they are supposed to be reasonably conservative, as judged by a complete and competent team), go get the actual information. Becoming more quantitative for those specific items.
- If risk justifies or digital circuit level data is readily already, perform RBI analysis from the P&ID level as fully semi-quantitative
- If risk justifies and it is appropriate, perform quantitative analyses such as a QRA (quantitative risk assessment), FFS analysis to obtain a thinner t-min for the RBI analysis or standalone, or HTHA study for equipment strategies in High Temperature Hydrogen Attack service, creep remnant life studies, etc. These are the most rigorous and costly analyses but may eventually be justified if the risks and payback are high enough. For example, a pro-active FFS in advance of hydrocracker inspections/turnaround may be justified to determine most critical areas for inspection and to create failure assessment diagrams (FAD) for maximum tolerable flaw sizes.
- At times, extremely detailed damage mechanisms reviews and/or IOW studies may compliment many of these activities. An effective job of IOW (integrity operating window) establishment, with a notification system for exceedences, can be a big help managing equipment in a dynamic environment by “catching” process changes that could affect equipment integrity or reliability in a timely manner. This potentially impacts the RBI, FFS and remnant life analyses. In order to set the stage, i.e. use word pictures, for facilitating a new way to look at work practices when teaching the API RBI 580/581 course I usually use the following:
- Question: Why do we usually inspect equipment?
Answer: Get additional information to “fine tune” or have a more accurate “picture” or understanding of the true damage state of the equipment in question. Another way to look at it is that when we inspect, if we have done a good job of identifying the potential damage mechanisms, are using the right methods to find the damage that can cause a breach of containment, we can get information to lessen the uncertainty of what we believe to be the damage state of the equipment.
2. RBI is primarily about answering this question, “How much confidence do I need to have in what I believe to be the condition of the equipment?”
Answer: We let risk and understanding risk drivers provide the direction and justification. For example, if a
risk based inspection analysis tells us we will reach the risk threshold4 on a certain date based on damage progression, the ability of the equipment to withstand the damage and the consequences, we will normally perform the inspection/s on or before that date to keep the risk within a certain criteria. Therefore, the combined consideration of probability of failure (PoF) and consequences, i.e. risk, is telling us how much confidence we need to have in our knowledge of the true damage state of the equipment.
Fitness for Service (FFS) – API 579-1/ASME FFS- 1, JUNE 5, 2007, (API 579 SECOND EDITION) – Scalable Accuracy
Although it would be ideal to cover FFS after RBI in this article, we will use FFS as our starting point. It is easier to understand scalable accuracy with FFS.
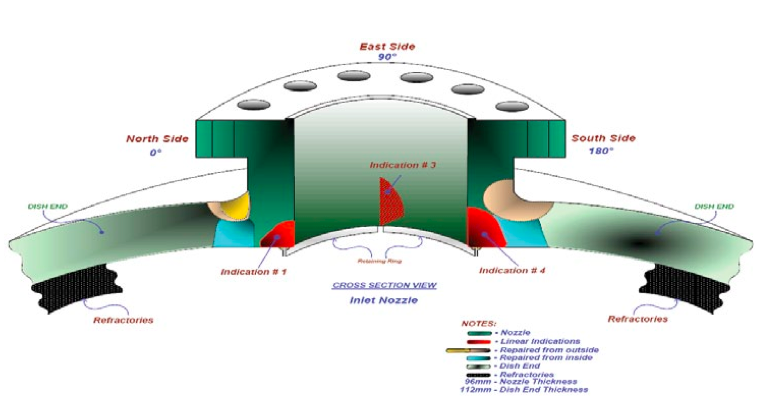
Example Four crack initiation sites were noted at the refractory retaining ring fillet welds at the base of the nozzle neck.
Let’s imagine one of your Reactor’s has four crack initiation sites at the refractory retaining ring fillet welds at the base of the nozzle neck. If you shut down the reactor for repair the unit will be down for four days at a lost production cost of $500K per day. Failure would be catastrophic and totally unacceptable, i.e. it is full of hydrocarbons at high temperatures and pressures. The next scheduled downtime is 8 months from now. In this case it is justified to perform a level 1 FFS analysis, the most coarse and most conservative approach, to determine suitability for service. If the vessel fails the first level analysis it is likely justified to perform a more detailed and costly Level 2 FFS analysis. This analysis may require some level of finite element modeling and collection of additional information. So it becomes more accurate.
If the level 2 FFS analysis yields results showing the vessel is still unacceptable for continued service it is likely justified, based on RBI results or other consequence criteria, performing a level 3 FFS analysis which requires more information, additional modeling and additional information as input.
Crack at the Retaining Ring Fillet Propagating into the Base Material
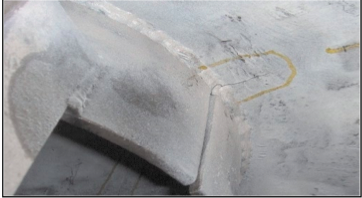
In this example the consequences of failure are extremely high for both injury and financial loss. Therefore, it was justified to become increasingly accurate in our analyses, going from level 1, to level 2 to level 3 FFS. Each level requires more information, analysis and cost. But it was worth it.
This would not have been the case had it been another example such as a heat exchanger shell with cooling tower water, thinning and possibly producing a leak. This heat exchanger can operate safely with a leak and can be easily repaired at the next turnaround in a week.
These examples demonstrate the use of a scalable accuracy approach based on risk.
It is critical that FFS practitioners understand that on- going use of damaged equipment requires surveillance or knowledge of future operating conditions as the safe prediction is based upon the equipment being operated within a certain safe envelope, i.e. where damage rates would not increase beyond and acceptable amount.
It is also important to note that the three levels of FFS analysis5 are calibrated against one another and do not conflict with one another as long as they are performed properly as per the procedures in the referenced standard.
Risk-Based Inspection
When using the scalable accuracy approach, we typically start with RBI. It is a higher level approach, allowing us to perform initial risk screening on literally 10s of thousands of pieces of equipment, risk ranking them, in relatively short order.
Our examples will be based on API RP 5816. The latest edition of RP 581, second edition, is very scalable. While it is semi-quantitative to quantitative the quantitativeness of it is based on the following:
- Level of damage mechanism review
- The PFD level review is generally speaking, the most coarse and therefore less quantitative, in other words more semi-quantitative
- The P&ID level review is more quantitative
2. Input data
- Actual, accurate data produces results with less scatter, hence more quantitative
3. Where actual data is not known or is very expensive to obtain it may be acceptable to use assumptions. Assumptions must always be made by knowledgeable people, as is appropriate for the assumption. For example, if corrosion rates as estimated by measured field thickness readings are unreliable the analyst may want to use a corrosion engineer’s best estimate. The corrosion engineer should be very familiar with that type of process unit and equipment, consult with operations to learn about operations as they relate to damage and expected damage rates, get the input of the area inspector, take into account similar types of units in industry, consider past failure histories for that unit and similar industry units, apply chemical, materials and physical laws/rules, etc. to arrive at a reasonably conservative corrosion rate for the analysis and future planning. The more one uses reasonably conservative assumptions the less accurate the analysis will be, erring to the conservative. This will often be more advantageous than conventional approaches.
The conservative inputs may eventually drive the owner operator to get more accurate data to drive the probability of failure down, if risk justifies it. For example;
A pressure vessel was commissioned into service in 1995. Original thickness was 0.500”, SA 516-70 material. An industry representative corrosion rate of 10 mils per year was used for the original RBI analysis. The team felt the real corrosion rate was closer to 5 mpy but wanted to be conservative. The RBI analysis shows the risk target or threshold being reached on April 5, 2012. The thinning mechanism is localized. RBI is calling for an A level (The inspection methods will correctly identify the true damage state in nearly every case (or 80–100% confidence)) effectiveness inspection for localized thinning. So on or before April 5 a “B” scan of 75% of potentially corroded area, as specified by a corrosion specialist, will be performed. This will cost money to get more data, to become more accurate, and risk says this is justified. Returning data confirms the actual corrosion rate is 5.5 mpy. The vessel operated safely for 17 years. The actual metal loss for those 17 years was 17 X 5.5 = 93 mils. So now the thinnest area on the vessel is 0.407”. The analyst may exercise the option to change the corrosion rate for analysis to something less than 10 mpy, as well, for the next calculation. This is another example of scalable accuracy and done at a higher level than FFS.
To take this example a step further let’s say that the current t-min is 0.400”. If risk justifies, an FFS may be performed for the future. The user may progress from a level 1 to a level 2 FFS as the calculated t-min from the 581 analysis may be near or the same as the design t-min. We will pretend the 579 level 2 calculated t-min is 0.300”. It will be important to notate each item in the database with t-min’s and resulting PoF calculations that are based on a FFS analysis versus a more conservative design or API RP 581 based t-min. When the required ligament or t-min is dropped to 0.300” the PoF will decrease, the calculated future wall loss rate will drop based on the confirmed 5.5 mpy corrosion rate, the future PoF will decrease compared to what it would have been with an 0.400” t-min. As the vessel wall continues to grow closer to the t-min risk will rise again. Then options such as de- rating, etc. might be exercised to keep the vessel in service. This example also shows the relationship between RBI and FFS.
It is important to note that for both RBI and FFS (heavily dependent upon the FCA or future corrosion allowance) process changes, other changes such as those handled by your MOC program, anything that can impact the damage rates and types of damage that the equipment can experience, must be monitored so we know if and when they occur. This will allow us to consider the information, reanalyze if necessary and make any necessary adjustments to our plans.
It was mentioned earlier, in the FFS portion of this article, “It is also important to note that these three levels are calibrated against one another and do not conflict with one another as long as they are performed properly as per the procedures in the referenced standard4.” The same is important for RBI analyses. If one is using tools with discretely different methods for quantitative and semi-quantitative analysis, they must be calibrated to each other so they produce results do not conflict. For example, I recall a population of 200 pieces of equipment that were fully analyzed at both level 1, qualitative, and level 2, semi-quantitative RBI. The original intent was to perform an initial RBI of the 200 items qualitatively and move high and medium-high risk items to the semi-quantitative analysis. Some of the equipment analyzed at the semi-quantitative level were rated at a higher risk than they were at the qualitative analysis level and should have been graduated to semi-quantitative, but never would have if the original strategy was implemented. The beauty of the 581 approach is that all equipment items are analyzed on the same platform and we are comparing ‘apples’ to ‘apples’, i.e. they are calibrated. The qualitativeness is introduced, at the desired level, via the approach and the amount of assumptions used. As more accuracy, data is needed, it is added, as dictated by risk, and all equipment is being risk ranked on the same level playing field.
Uncertainty and Certainty

The model above illustrates what happens when we have scatter in data and ensuing output results. The intent with qualitative RBI or more conservative FFS is that we err to the conservative. In this case our scatter is above the Absolute Certainty line.
If we err to the non-conservative side of the model, or below the Absolute Certainty line, we may be in no- man’s land. Examples of when this happens are when we use inexperienced or unqualified people for the damage mechanisms assignment or to make reasonably conservative assumptions in RBI or FFS, when we have erroneous data, when conditions driving the damage change and we don’t know it, etc.
Using this scalable accuracy approach one can optimize the use of resources and money.
Conclusion
Hopefully readers can see by showing how the latest API RP 581 technology is a fully calibrated risk model, able to be used qualitatively to semi-quantitatively and augmented with a scalable way to get an adjusted, more accurate t-min and PoF, very powerful and provides answers to the 12 dilemmas presented at the beginning of this article. Consistency, systematic work processes, documentation of assumptions and engaging qualified analysts and team members is certainly important. Regarding the Certainty Uncertainty Model, as equipment gets older or more damaged, if risk justifies, we will get more data to tell us more about the condition of the equipment and we will grow closer and closer to the absolute certainty line about the true damage state or condition of the equipment. At the right time we will either repair or replace the equipment. We may, during the course of the equipment lifecycle, decide to mitigate or slow the amount of damage to prolong equipment life by introducing a lining, injecting a chemical to slow corrosion, etc.
Finally, as an example of how dilemma #6 is answered, the risk analysis provides information needed to convince management. The process may also remove some items from that list as tool like RBI help identify non-value adding practices through a systematic, consistent, technically sound approach.


Comments and Discussion
There are no comments yet.
Add a Comment
Please log in or register to participate in comments and discussions.