Introduction
Historical inspection data plays a pivotal role in the industrial asset management industry, helping owner-operators make critical inspection, maintenance, and repair decisions that directly impact the integrity and reliability of their facilities. Despite the important role that data plays in making these decisions, industry practitioners are often hesitant to fully trust their data. In our recent Inspectioneering Journal article, “Don’t Throw Out Your IDMS Data: Use Statistics to Rebuild Trust,” we outlined four commonly encountered data integrity challenges:
- Outlier Data Readings
- Thickness Measurement Growths
- Potential Resets and Repairs
- Missing Data Values
In this short follow-up blog, we consider a fifth challenge: Suspicious Time Periods, where one might trust most of the historical inspection data they have at their disposal except for data collected over a certain date range. The basis for this mistrust can range from major equipment overhauls, to inspection program changes (potentially causing mistrust in data collected under previous programs), to simply a mistrust in the inspection personnel over a small date range of, say, less than five years.
We recently conducted a study on thickness data from a major refiner who had reasons to believe that data collected prior to 2015 should be removed from future analysis tasks. Our goal was to determine if this was the case and, if it was, if there was any value in the data collected prior to 2015. This task is one that is statistically testable, meaning that we can apply statistics to provide quantitative, rather than purely qualitative, justifications for our recommendations.
Method
We can help this refiner determine if it should remove data collected prior to 2015 from future analysis tasks by examining the number of anomalous data points detected using only the data collected before 2015, only the data collected after 2015, and all available data taken together. For a brief overview, an outlier is a measurement value that does not fit well with the other available data points. Outliers can be assessed by inserting a best-fit regression line through your thickness data and calculating a confidence interval around that regression line. Any points falling outside of that confidence interval should be flagged as outliers. Figure 1 illustrates the identification of an outlier.
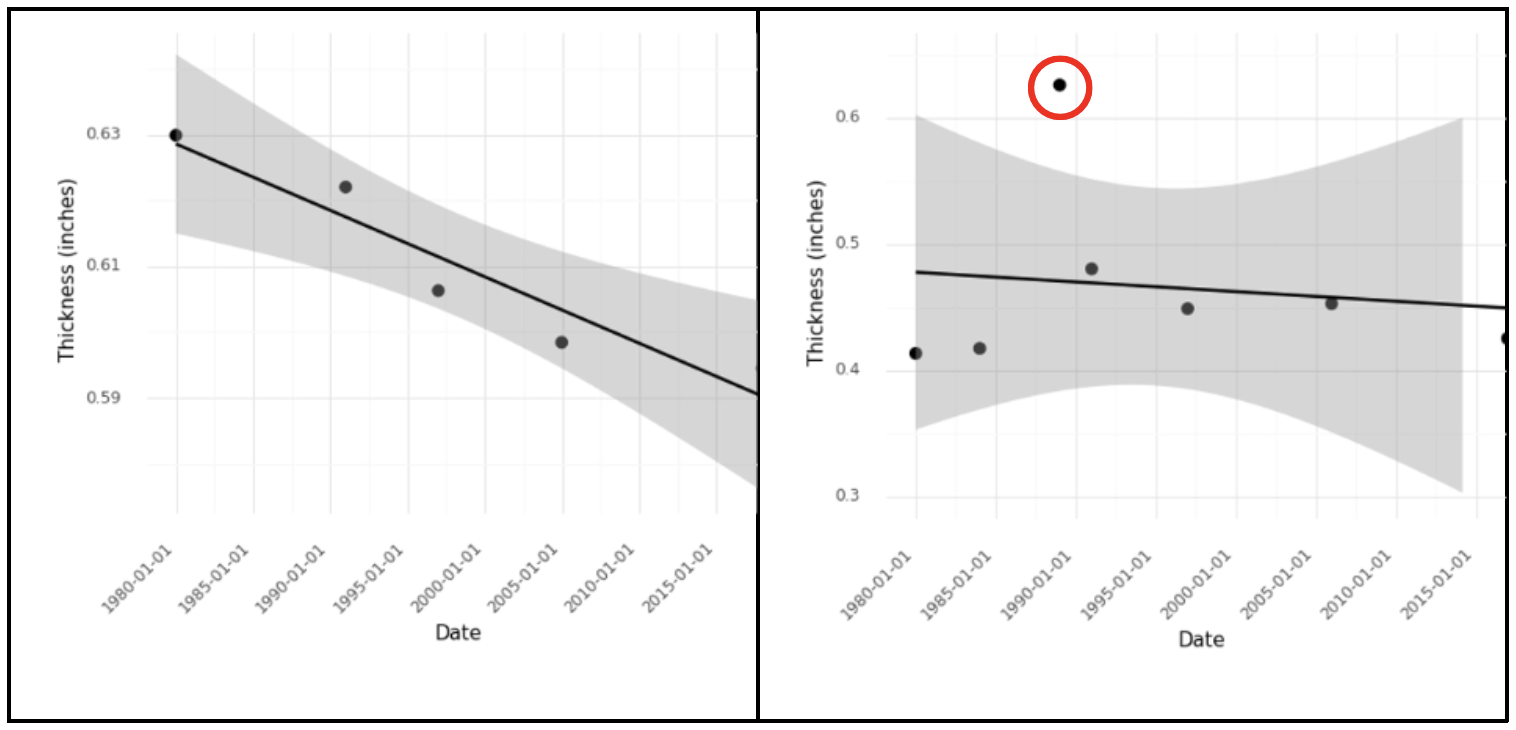
Figure 1b. A single outlier point (red circle) dramatically increases the size of the confidence interval.
In this case, we computed the number of detected outliers for the three time periods outlined above. We found that more than 20% of CMLs in the population had no outliers when only analyzing the pre-2015 or post-2015 data, but did contain outliers when examining all of the data together. This clearly indicated that, for a large percentage of CMLs, the post-2015 data did indeed change the statistics of our data and could not be considered statistically equivalent to data taken pre-2015. In short, the refiner’s suspicions were correct, and this could be shown quantitatively.
However, simply deleting this data would be highly inadvisable. In our analysis, we found that historical corrosion rates prior to 2015 were significantly higher than the post-2015 rates in roughly 80% of the CML population. The pre-2015 data did provide a window into how bad corrosion can be for these CML populations – information that can be useful when estimating future degradation and worst-case behavior for the assets in question.
Conclusion
Facilities are often suspicious of thickness data collected during certain date ranges. Statistics and quantitative methods can evaluate whether these concerns are valid and to what extent suspicious data can complicate analysis tasks. In our analysis of the real inspection dataset, we found that the refiner’s concerns regarding their data were indeed justified and that some data isolation for analysis tasks was justified. However, the previously collected data still provided useful information regarding past behavior that could prove helpful when predicting future asset behavior.


Comments and Discussion
There are no comments yet.
Add a Comment
Please log in or register to participate in comments and discussions.