The RBI Process
RBI Assessment Planning
One of the earliest and most important steps in the RBI process is defining and documenting the scope and priorities of the RBI assessment. Being that the RBI process involves multiple people and roles (i.e., the RBI team), the planning process needs to:
- Focus efforts by screening risks,
- Set assessment boundaries to include only what is needed in the assessment, and
- Align priorities and objectives to make the assessment more efficient and effective.
An effective RBI plan contains the objectives of the assessment, its physical and operating boundaries, and screening questions and criteria that are consistent with the stated objectives and in-line with identified boundaries.
API RP 580 provides a list of questions that should be answered at the beginning of the assessment planning process:
- Why the assessment is being done?
- How the RBI assessment will be carried out?
- What knowledge and skills are required for the assessment?
- Who is on the RBI team?
- What are their roles in the RBI process?
- Who is responsible and accountable for what actions?
- Which facilities, assets, and components will be included?
- What data is to be used in the assessment?
- What codes and standards are applicable?
- When the assessment will be completed?
- How long the assessment will remain in effect and when it will be updated?
- How the results will be used?
- What is the plan period?
Assessment Planning Step 1: Establish Objectives & Goals
All RBI assessments should be conducted with stated objectives that are clear to everyone involved in the assessment, including RBI team members and management. An RBI assessment may be undertaken with many objectives. API RP 580 provides some examples, including the following:
| Objective | Description |
| Understand Risk | Increased understanding of the operating risks associated with and the effects inspection, maintenance activities, or mitigation actions have on a facility, process unit, system, equipment, or component. Once risk is understood, activities can be planned to better optimize time and streamline the use of resources. |
| Define Risk Criteria | The RBI assessment will provide the risk associated with the equipment included in the assessment. This can be used to establish criteria for determining the acceptability of risks. |
| Risk Management | The RBI team can use the results of the assessment to take actions to reduce risk to an acceptable level and, as a result, improve safety and decrease the likelihood of losses containment or other failures. |
| Cost Reduction |
API RP 580 lists cost reduction with other potential objectives. Although reducing cost is not a direct objective of an RBI assessment, understanding risk may bring about some cost reduction benefits. Per API RP 580, these may include:
|
| Meet Safety and Environmental Management Requirements | As a complement to other risk and safety initiatives, the outputs of an RBI assessment allow for the ranking of areas with the greatest risk, which in turn can be addressed systematically to meet safety and environmental requirements. |
| Identify Mitigation Alternatives |
An RBI assessment may reveal risks that can be mitigated through non-inspection means. API RP 580 provides the following examples of such mitigation alternatives:
|
| New Project Risk Assessment | When conducted on new equipment or projects, an RBI assessment may provide information that will reduce risk by altering design. |
| Develop End of Life Strategies | RBI may be useful for maximizing the economic benefits of equipment nearing the end of service life with minimal risk. |
Assessment Planning Step 2: Screen Equipment & Establish Assessment Boundaries
The volume of equipment in a facility can make the RBI process seem overwhelming and cost-prohibitive. For this reason, the screening process narrows the scope of the analysis to focus on the most important equipment. This will help to ensure that time and resources are used in an effective manner.
It is important to consider the established objectives when determining the boundaries of the RBI assessment. Special attention should be given to the amount of data and resources required to assess the areas within the determined boundaries, as they should be consistent with what is required to achieve the established objectives.
Define the Physical Boundaries of the RBI Assessment
The physical scope of an RBI assessment can range from an entire facility (the highest level) to a single component at the most detailed level.
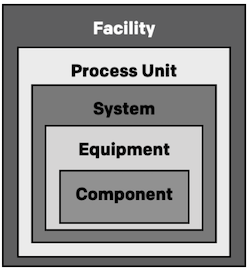
API RP 580 defines each of the physical boundary screening types as follows:
- Facility Screening: "Any location containing equipment and/or components to be addressed under this RP." A simplified qualitative RBI assessment may be used to screen at the facility level. API RP 580 provides additional guidelines to consider for facility screening, including asset or product value, equipment history, age, etc.
- Process Unit Screening: "A group of systems arranged in a specific fashion to produce a product or service. Examples of processes include power generation, acid production, fuel oil production, and ethylene production." Multi-unit facilities should be screened by screening entire process units to rank all of the relative risks. The risk ranking can then be used to prioritize the order of units to be addressed. Oftentimes maintenance outages or turnarounds may influence the priority of units for RBI analysis.
- Systems Screening: "A collection of equipment assembled for a specific function within a process unit. Examples of systems include service water system, distillation systems, and separation systems [...] It is often advantageous to group equipment within a process unit into systems, loops, or circuits where common environmental operating conditions exist based on process chemistry, pressure and temperature, metallurgy, equipment design, and operating history. By dividing a process unit into systems, the equipment can be screened together saving time compared to treating each piece of equipment separately."
- Equipment Screening: "An individual item that is part of a system. Examples include pressure vessels, relief devices, piping, boilers, and heaters [...] In most plants, a large percentage of the total unit risk will be concentrated in a relatively small percentage of the equipment items. These potential high-risk items should receive greater attention in the risk assessment. Screening of equipment items is sometimes conducted to identify the higher risk items to carry forward to more detailed risk assessment."
- Components: "Parts that make up a piece of equipment or equipment item. For example a pressure boundary may consist of components (pipe, elbows, nipples, heads, shells, nozzles, stiffening rings, skirts, supports, etc.) that are bolted or welded into assembles to make up equipment items." Although an RBI assessment could be used to assess a single component, it is more common to assess multiple components as one item. For example, while a column bottom may be made of various plate sections and a head, RBI will typically model the worst-case section and corrosion rate as representative of the the column bottom, since modeling all courses for all vessels may be unnecessary.
Define the Operating Boundaries of the RBI Assessment
Establishing operational boundaries enables one to identify key process parameters and operating practices that may impact damage types, deterioration rates, and equipment remaining life. For example,
- How do start-up and shutdown affect the deterioration types and rates?
- What is the impact of normal, upset, or cyclic operation of equipment on deterioration types and rates?
- How does the operating time period impact deterioration types and rates?
Assessment Planning Step 3: Select RBI Assessment Type
RBI assessments can range from very subjective, opinion-based qualitative approaches to data-intensive quantitative approaches. Qualitative RBI, while easier to implement, requires thorough documentation in order to achieve replicability. On the other hand, quantitative RBI uses discrete data and much less subjectivity. Some level of opinion is used, albeit much less in quantitative analyses.
When choosing an assessment type, one may consider factors such as:
- Whether the assessment is done at a facility, process unit, system, equipment, or component level
- The availability of quality data as well as the expertise to analyze that data
- The availability of resources (i.e., team members)
- Time constraints
- Management requirements for metrics
Assessment Planning Step 4: Estimate Required Time & Resources
After selecting an RBI assessment type and the scope of implementation, it is important to consider the time and resources that will be required to implement the RBI program. Time and resources may vary based on numerous factors, such as:
- The knowledge and experience of the RBI team members (more experience = less time and resources)
- The level of detail desired from the output, including inspection strategies (more detail = more time and resources)
- The availability of data (more available data = less time and resources)
- The availability of the team members (more availability = less time and resources)
Data & Information Collection
RBI requires data. The type of RBI analysis selected, as well as the level of accuracy and precision desired, will dictate the data requirements of the RBI program. This section covers data needs, common types of data, and data quality.
Data Needs & Common Types of Data
The different RBI assessment types (qualitative, semi-quantitative, and quantitative) each require different levels and amounts of data. Furthermore, in the absence of data, assumptions are often used. Great care should be taken when determining and documenting the rationale for these assumptions.
| Data Needs for RBI Assessments | |
| Qualitative RBI |
|
| Quantitative RBI |
|
| Semi-Quantitative RBI |
|
Data Quality
The quality of data gathered will have an impact on the accuracy and credibility of the RBI analysis. In short: Garbage in, garbage out.
Data inputs and assumptions must be subject to a credible validation process. This validation process helps to ensure that erroneous or incomplete data is either corrected or doesn’t find its way into the RBI analysis at all.
Data Sources
Data sources are numerous and may exist digitally or in paper form. Examples of data sources include P&IDs, PFDs, heat and material balances, materials of construction records, U-1 forms, inspection records, MOC records, plant and industry failure data, PHAs, QRA studies, climate/weather records, among others. There are a vast number of data sources that should be considered; refer to documents such as API RP 580 for more examples.
Damage Mechanisms & Failure Modes Identification
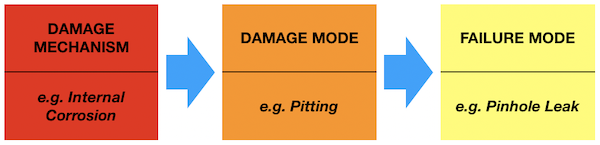
API RP 580 (Third Edition) provides helpful definitions for damage mechanisms, damage modes, and failure modes. Understanding the difference between these three terms is necessary throughout the RBI process.
Damage Mechanisms
Per API RP 580, a damage mechanism is "a process that induces micro and/or macro material changes over time that are harmful to the material condition or mechanical properties. Damage mechanisms are usually incremental, cumulative, and, in some instances, unrecoverable. Common damage mechanisms include corrosion, stress corrosion cracking, creep, erosion, fatigue, fracture, and thermal aging."
Understanding damage mechanisms is important for:
- Analysis of the PoF
- Selection of appropriate inspection intervals/due dates, locations, and techniques
- The ability to make decisions (e.g., modifications to process, materials selection, monitoring, etc.) that can eliminate or reduce the probability of a specific damage mechanism
Failure Modes
Per API RP 580, a failure mode is "the manner of failure. For RBI, the failure of concern is loss of containment of pressurized equipment items. Examples of failure modes are small hole, crack, and rupture."
Failure modes identify how the damaged component will fail. Understanding failure modes is important for three reasons:
- The analysis of the CoF (e.g., how much fluid would be released in the event of a failure)
- The ability to make run-or-repair decisions
- The selection of repair techniques
Damage Modes
Per API RP 580, a damage mode is "the physical manifestation of damage (e.g., wall thinning, pitting, cracking, rupture)."
Damage Mechanisms Reviews
A credible Damage Mechanisms Review (DMR) should be performed by a qualified corrosion specialist. This review must identify all anticipated types of damage, and it should include estimated damage rates and damage modes as supplied by SMEs. It should also identify locations of expected damage at a system and component level, as well as damage morphology. In addition to steady-state operations, the impact of fabrication, repairs, heat treatment, start-ups and shutdowns, intermittent operations, and operating outside of acceptable envelopes must be factored into the DMR. The level of detail (e.g., DMR from the PFD versus the P&ID levels), will vary depending upon the damage complexity of the unit.
After identifying damage mechanisms, the corrosion/materials specialist should identify the most likely failure modes. Examples of failure modes are leak before break, rupture, pinhole leak, etc.
The RBI analysis should consider the combined effects of all potential damage types, individually and collectively, on the integrity of components. This concept is referred to as accumulated damage. As an example, although a piping circuit may be primarily affected by corrosion under insulation, one should also consider the impact of additional damage mechanisms that contribute to the overall degradation of the piping that may ultimately lead to a leak or failure.
Probability of Failure Assessment
Once damage mechanisms have been identified, an analysis to estimate the probability that a specific adverse consequence or event will occur as a result of the damage mechanism causing a loss of containment. Examples of adverse consequences or events include vapor cloud explosions, pool fires, flash fires, etc. Although, other factors may cause a loss of containment (e.g., design errors, extreme weather) and, thus, impact the probability of failure, a typical RBI assessment considers damage mechanisms.
PoF assessments should address all possible damage mechanisms and multiple damage mechanisms simultaneously where equipment is susceptible to multiple damage mechanisms. The analysis must be credible, repeatable, and documented.
Units of Measure for PoF Analysis
PoF is expressed in terms of frequency, or a number of events occurring during a specific timeframe. An example of frequency in qualitative terms is one leak per year. Qualitative frequencies may also be expressed categorically (e.g., high, medium, and low, or one through five). An example of frequency in quantitative terms is an annual failure probability of <0.0001, or one leak in 10,000 years.
Types of Probability Analysis
The types of probability analysis are broken up into two assessment types, “qualitative” and “quantitative”. These two categories are opposite one another; they are the endpoints of a continuum. Most probability assessments use a blend of the two. Regardless of the method used, a sensitivity analysis should be used to assure that realistic probability values are achieved.
The qualitative method identifies the key ingredients of the assets including the materials, corrosive environment and performance history. This approach can be done at a high level or as granular as desired. The categories of POF typically used in a qualitative method are “low,'' “medium” and “high”, or with numbers, it is described as “(x) amount per (x) years.” There’s no set rule for this, but those are the most common.
The quantitative method uses specific failure data or expert assumptions to determine PoF. Typically this data would come directly from the asset or an asset in similar service. This value of PoF is typically numerical and is expressed as a distribution relative to the other assets in the study. When inaccurate or insufficient data exists for the particular asset, general industry, company or manufacturer failure data is used. This data should be adjusted to be more specific to the asset being analyzed. For instance, if your corrosion rate data is based on industry norm and you’re operating just outside the industry norm, you’ll want to adjust your corrosion rate up or down for that particular asset.
Determination of PoF
Whether qualitative or quantitative, PoF is determined by two main considerations:
- Damage mechanisms and rate of degradation based on the materials.
- Effectiveness of the inspection methods used to identify and monitor the damage.
The Effect of Inservice Damage
Analyzing the effect of deterioration and the inspection methods used to monitor it involve the following:
- Identify the damage mechanisms
- Determine the susceptibility to the damage and the expected rate of damage.
- Evaluate the effectiveness of past inspections to identify and monitor the damage.
- Determine the future rate of degradation and the date in which it causes failure based on the information above.
Determine Failure Mode
The failure mode should be determined based on the damage mechanism. Consideration should be given to multiple failure modes when determining risk.
Some examples of failure modes:
- Small leak (pinhole)
- Large Leak
- Rupture or full line separation
Determine Damage Susceptibility and Rate
Process conditions and materials of construction shall be evaluated to identify active and credible damage mechanisms. An efficient method of doing this involves grouping components of similar metallurgy that operate in similar process conditions. This way, the effects and inspection results from one item in the group can be related to the others in the same group.
For many damage mechanisms, estimated degradation rates can be used. For thinning, corrosion rates are typically used. For cracking and some other immeasurable damage mechanisms, susceptibility is often used. Susceptibility is typically designated as high, medium, or low based on the metallurgy and operating conditions.
Because of equipment and process complexity, most deterioration rates are not 100% certain. They are based on published data, lab data, in-service monitoring, similar service experience, inspection history and the inspector’s expertise. The best data comes from operating experiences where the damage was positively identified in one asset, and the condition that led to the damage can realistically occur in the asset under consideration.
Degradation rates will often vary as the mechanism progresses. In some cases, the damage will only get to a certain point and slow or stop. In other cases, the damage may progress to the point that another damage mechanism takes over (e.g., pitting that gives rise to stress corrosion cracking).
All process design and upset information (e.g., pressure, temperature, contaminants) shall be used in conjunction with the asset design and metallurgy information when determining damage rates.
When determining failure mode and the probability that each failure mode will occur, it’s important to link the damage mechanisms to the most likely resulting failure mode (e.g., pitting leads to small holes, stress cracking leads to through wall cracks, general thinning leads to ruptures, etc.).
Determine Effectiveness of Past Inspection Program
Inspections, including all NDE, vary in their ability to locate and size damage, thus varying the effectiveness of the inspection method to determine the deterioration rate.
After the susceptible damage mechanisms have been identified, the inspections shall be evaluated to determine their effectiveness in finding and sizing that damage mechanism. Since every damage mechanism is unique to the inspection method used to identify it, each damage mechanism is evaluated separately and is based on both the method itself and the extent that it is used.
When evaluating inspection methods, the inspection effectiveness may be limited. The effectiveness of an inspection could be limited due to lack of coverage, inherent NDE limitations, or inadequate NDE qualifications or procedures.
Operating conditions change over time. If more than one inspection has been performed, it’s important to recognize that the most recent inspection will more than likely reflect the latest operating conditions. The older inspections may apply to older and outdated operating conditions and damage mechanisms, making the older inspections less effective for the newer operating conditions and damage mechanisms.
When determining the effectiveness of inspections, consider the following:
- Equipment type
- Active/credible damage mechanisms
- Rate of deterioration
- NDE methods and coverage used
- Accessibility to the suspected damaged areas
Calculate the PoF by Deterioration Type
Using the inspection data and inspection effectiveness, process monitoring, and expected damage mechanisms and rates of degradation, PoF can be determined for each deterioration type and failure mode.
Consequence of Failure Assessment
Consequence of failure (CoF) should be assessed with the determination of PoF. CoF analysis estimates the consequences that occur as a result of a specific failure mode, which is often attributed to a single or multiple damage mechanism(s). All potential failure modes in which the equipment may be susceptible to should be addressed. The results of a CoF provide a basis for discriminating (and prioritizing) equipment based on the potential severity or significance of a failure. For example, with regard to CoF, a rupture in HF acid service will be prioritized above a pinhole leak in lube oil service.
Typically, CoF is categorized as:
- safety and health impact
- environmental impact
- economic impact
Inspectors or inspection engineers typically manage PoF with inspections and planned maintenance. CoF, on the other hand, is typically out of the hands of inspections. CoF is typically controlled by management or process safety personnel. For example, management or process safety personnel may decide to reduce the inventory of a vessel to reduce the CoF in the event of a release.
Loss of Containment
Loss of containment (LOC) is the primary concern with regard to RBI. Typically, LOC refers to a loss of fluid to the external environment. A pipe that develops a leak that causes fluids to find their way into the surrounding area can be classified as an LOC event. On the other hand, an exchanger bundle that develops a tube leak and cross-contamination of the process is usually not considered a loss of containment because the fluid did not reach the external environment.
Losses of containment can be categorized by their resultant impacts:
- Safety and health impact: will a loss of containment affect the health or safety of personnel?
- Environmental impact: will a loss of containment adversely affect the environment?
- Production losses (economic): will a loss of containment require a unit shutdown or slowdown?
- Maintenance costs (economic): will a loss of containment require maintenance follow-up or repairs?
Other Functional Failures
As stated above, the consequences addressed by a CoF assessment are most commonly a result of a loss of containment and are typically categorized as the impact to health and safety, the environment, and/or cost. However, consequences of failures other than loss of containment may also be included in the RBI assessment. For example, heat exchanger tube failures, relief valve failures, and pump seal leaks may be considered other functional failures. Like PoF, the analysis for determining CoF must be credible, repeatable, and documented.
Consequence Analysis Types
Similar to PoF, consequence analyses can be qualitative, quantitative, or somewhere in between (semi-quantitative).
Qualitative Consequence Analysis
A qualitative method identifies the asset or group of assets, along with the operating conditions and process fluids that would contribute to the total volume lost in a given loss of containment scenario. The categories of CoF typically used in a qualitative method are “A” through “E” or “low,'' “medium” and “high”. In addition, it’s sometimes beneficial to associate an estimated cost range associated with each category (e.g., less than $100,000, between $100,000 and $1,000,000, between $1,000,000 and $10,000,000, and greater than $10,000,000).
Quantitative Consequence Analysis
A quantitative method goes a bit more in-depth. Logic models are used to mock run failure scenarios and represent their effects on people, property, business, and the environment. The models consider more detailed information about the process fluid, operating conditions, total volume, and failure modes.
Results of a quantitative analysis are usually numeric and are often grouped into manageable ranges.
Units of Measure for CoF Analysis
There’s no mandated unit of measure for CoF analysis. In short, the analyst should choose a unit of measure that’s relatable to the nature of the hazards present.
The following are examples to consider.
Health and Safety
Typically health and safety consequences are expressed as a numerical value or a category associated with severity.
For example, safety consequences could be expressed based on the severity and frequency of an injury (e.g., first aid, medical treatment, serious injury, fatality) or as a category linked to severity (e.g., A through E). API RP 581 describes an approach to assigning health and safety areas and/or monetary values to safety and health consequences.
Environmental Damage
Environmental consequence measures are the least developed because there’s no common unit of measure available. The typical parameters used to measure the degree of damage are as follows:
- Acres of land affected per year
- Miles of shoreline affected per year
- Amount of biological or human-use resources consumed
Categorizing Safety, Health, and Environmental Consequences
The following tables show examples of three- and six-level category tables for safety, health, and environmental consequences:
Three Level Safety, Health, and Environmental Consequence Categories
| Category | Safety Consequence | Health Consequence | Environmental Consequence |
| High | Fatality or injury with permanent disability | Long-term health effects | Major off-site response and cleanup effort |
| Moderate | Lost time injury with full recovery expected | Short-term health effect with full recovery expected | Minor off-site, but possible major on-site response |
| Low | First-aid only injury | Minimal health impact | Minor on-site reponse |
Six Level Safety, Health, and Environmental Consequence Categories
| Category | Description | Examples |
| I | Catastrophic | Large number of fatalities and/or major long-term environmental impact |
| II | Major | A few fatalities, and/or major short-term environmental impact |
| III | Serious | Serious injuries and/or significant environmental impact |
| IV | Significant | Minor injuries and/or short-term environmental impact |
| V | Minor | First-aid injuries only and/or minimal environmental impact |
| VI | Insignificant | No significant consequence |
Economic Consequences
Economic consequences (i.e., cost) are commonly used as an indicator of potential consequences. When using cost, it’s common to assign monetary units (e.g., dollars) to categories like low, moderate, and high. For example, low may reflect a cost consequence of less than $100,000; whereas high may reflect a cost greater than $10,000,000. This allows multiple consequences, in monetary format, to be combined to determine the cumulative consequence category. This also allows the facilitator to draw comparisons from one event to another.
Economic consequences can be used for just about any event. Common considerations are production loss due to downtime, emergency response, maintenance and repair of damaged equipment, clean-up, as well as off-site effects such as loss of market share, damage to neighboring property, and even fines. Not all of these will be practical for every case, but it should give an idea of the common considerations.
Cost usually requires more detailed information on things such as product value, equipment costs, repair costs, resources, etc. Typically, the values are approximates; but the more accurate the better.
Similar to the six-level category table for safety, health, and environmental consequences, below is an example of a six-level table for economic consequences or cost:
Six Level Economic Consequence Categories
| Category | Description | Economic Loss Range |
| I | Catastrophic | > $100,000,000 |
| II | Major | > $10,000,000 < $100,000,000 |
| III | Serious | > $1,000,000 < $10,000,000 |
| IV | Significant | > $100,000 < $1,000,000 |
| V | Minor | > $10,000 < $100,000 |
| VI | Insignificant | < $10,000 |
Volume of Fluid Released
When determining the magnitude of the consequence, the volume of fluid released is key. This takes into account the total volume of an asset or group of assets, the failure mode, leak rate, and the time it takes to not only detect but to stop the leak.
In some cases the volume released is simply the total volume available, however there are safeguards and procedures that can help minimize the volume released. For example, local H2S monitors can quickly notify operations of an H2S leak, and fast-acting emergency isolation valves can minimize the time it takes to isolate the release. Together, these minimize the total volume released.
Consequence Effect Categories
The RBI analyst should assure that the appropriate factors are considered when determining the consequence of failure. These factors include flammable events (fire and explosion), toxic releases or release of other hazardous fluids, environmental consequences, production consequences, loss of production and maintenance to restore.
Each of these events are described in further detail below.
Flammable Events
Flammable events occur when a leak finds an ignition source or auto-ignites. There are two types of damage caused during flammable events: thermal radiation and blast overpressure.
Most thermal damage happens close to the source, but blast overpressure affects a larger area further away from the source.
Typically, fire and explosion events are categorized as vapor cloud explosion, pool fire, jet fire, flash fire, or boiling liquid expanding vapor explosion (BLEVE).
Toxic Releases
In RBI, toxic releases are only addressed when they affect personnel (on-site and public). Toxic releases have the capability of affecting areas at a much greater distance from the source as compared to flammable events. RBI focuses on the acute high exposure risks rather than long-term low-level exposures.
To assess the toxic consequence, the RBI analyst needs to account for the following:
- Volume of fluid released and toxicity
- The ability of the toxic release to disperse under typical process and environmental conditions
- Detection and mitigation systems
- Population in the vicinity of the release
Other Hazardous Fluids
Other hazardous fluid releases include streams such as steam, hot water, acids and caustics. These streams can have safety consequences if contacted. Generally, the consequence is significantly lower than flammable or toxic releases because the affected area is likely to be much smaller.
When considering other hazardous fluids, one must take into account things like the volume released, personnel density, type of fluid, resulting injury type, and the usual safety systems, environmental damage and equipment damage.
Environmental
Environmental consequences are important and typically account for things like the volume released, ability to flash, leak containment, resources affected and regulatory violations.
Liquid releases can contaminate soil and water. Gaseous releases are more difficult to assess due to regulatory constraints and their associated penalties.
The environmental cost should include the cost to clean, cost of fines, and other costs. The cleanup costs should account for the type and volume of spill, location of the spill, and the method to clean up. The fines are dependant on the local laws, regulations, and jurisdictions. Litigation costs could also play a role, depending on the locale of the facility.
Production/Business Interruption
Most releases are accompanied by a loss of production or equipment shutdown. Ultimately, a loss of production is an economic consequence. These typically don’t have a major effect on risk, but may be a factor when combined with other consequences such as flammable, toxic, or environmental.
The amount of production lost is determined by multiplying the value of the product lost by the volume released. This is usually a very dynamic process, varying from site to site. All sites are configured differently and have different ways to minimize downtime (e.g., bypasses, spare equipment, etc.).
Maintenance and Reconstruction Impact
Maintenance and reconstruction impact accounts for the effort to restore the failed equipment to an operating state. This is usually expressed in an amount of money and should be estimated by someone experienced in maintenance costs and activities.
Determination of CoF
The consequence of a release is estimated by applying a six step process to each specific scenario. If there is more than one credible scenario, the steps are repeated for each scenario. The steps are as follows:
- Estimate the release rate
- Estimate the volume released
- Determine the rate of the release (rapid/instantaneous or slow/continuous).
- Determine if the release is a liquid or gas
- Estimate the effects of mitigation systems
- Estimate the consequences
Factors for Estimating Consequence
Estimating consequence can be very complicated. There are many factors to consider, and in most cases it’s helpful to have a list of factors to help trigger discussion. Some examples to consider:
- Consider the properties of the contained material.
- Determine if it’s flammable or toxic and how quickly it will release.
- Consider outside effects that could escalate the event such as common weather conditions.
- Determine the mitigation actions and their effectiveness.
- Consider the impact to plant personnel, equipment, nearby communities and the environment.
- Consider the economic losses due to a shutdown or slowdown.
Furthermore, one should consider multiple consequences, including scenarios that may initiate other consequences. For example, a pinhole leak finds an ignition source and ignites. This creates both a pinhole leak scenario and a fire scenario. If there’s a large enough volume of fluid that would lead to a long duration fire, this could cause a full line failure (rupture) scenario.
It is important when developing these scenarios to consider their plausibility. Don’t get lost evaluating a scenario that isn’t possible.
Factors for More Rigorous Methods
Each credible scenario will be given a probability of occurrence. For example, the facilitator will ask “what is the likelihood that the pinhole leak will find an ignition source?” Another question may be “what is the likelihood that the leak will occur long enough to pool?”
The likelihood will typically be given a category such as high, medium, and low; or they may be numeric using a scale of 1 to 10. Another method is to measure the consequence by estimating the number of injuries or fatalities and determining the economic losses in monetary units.
Risk Determination, Assessment, and Management
As stated earlier, risk is the product of probability and consequence.
Risk = Probability x Consequence
Determination of the Probability of a Specific Consequence
Now that the PoF and failure modes have been determined, one can determine the probability of each credible consequence. Remember to only evaluate credible consequences and not get lost in scenarios that aren’t possible.
The loss of containment failure may be just the first event in a series of events leading to a specific consequence. For example, following the loss of containment, maybe the leak finds an ignition source and ignites. Maybe the ignition creates a large fire that causes damage to equipment or injuries to personnel. This would be one specific credible consequence that needs to be evaluated.
When evaluating the example above, each individual event leading up to the damaged equipment or injured personnel needs to be given a probability. What’s the likelihood that the loss of containment finds an ignition source? Then, what’s the likelihood that the ignition creates a large fire? Finally, what’s the likelihood that the fire will cause damage to equipment or injuries to personnel?
These are the questions that need to be asked when determining the probability of a specific consequence. This process needs to be performed for each credible consequence. It’s important to be realistic when assigning probability to these individual consequences. For example, although it’s possible; it’s not likely that a pinhole leak will lead to a major fire; therefore this specific consequence should have a low probability.
In order to avoid an overly conservative or liberalistic risk assessment, personnel who are qualified and experienced in the risk assessment method should be involved in this process.
Calculating the Probability of a Specific Consequence
The following example is provided in section 11.2.2 of API RP 580 and demonstrates how to calculate the probability of a specific consequence by combining the probabilities of individual consequences.
|
An equipment item containing a flammable fluid is being assessed. The probability of a specific consequence should be the product of the probability of each event that could result in the specific consequence. In this example, the specific consequence being evaluated is a fire (an example event tree starting with a loss of containment is shown below). The probability of a fire would be: probability of fire = probability of failure x probability of ignition probability of fire = 0.001 per year x 0.01 probability of fire = 0.00001 or 1.00E-05 The probability of no fire encompasses two scenarios (loss of containment without ignition and no loss of containment). The probability of no fire would be: probability of no fire = (probability of failure x probability of non-ignition) + probability of no failure probability of no fire = (0.001 per year x 0.99) + 0.999 per year probability of no fire = 0.99999 per year NOTE: The probability of all consequence scenarios should equal 1.0. In the example, the probability of the specific consequence of a fire (1E10-5 per year) plus the probability of no fire (0.999999 per year) equals 1.0. If the consequence of a fire had been assessed at $1E07, then the resulting risk would be: risk of fire =1.00E-05 per year x $1E07 = $100 per year NOTE: The overall risk includes the probability of loss of containment. For example, if the probability of loss of containment is 0.1, the overall risk above is 0.1 x $100/year = $10/year. Source: API RP 581 Risk-Based Inspection, Third Edition |
Assumptions
Assumptions are typically used when data isn’t available or if the data doesn’t give the level of conservatism desired. For example, an asset in a system known throughout the industry for having a high corrosion rate is actually showing a low corrosion rate. Assumed corrosion rates may be utilized if it’s uncertain why the corrosion rates are unusually lower than the industry norm. Keep in mind that using overly conservative assumptions will inflate the risk and may lead to unnecessary inspections.
Overinflated risk values, unnecessary planning, and unnecessary inspections lead to a lack of credibility in the RBI process. Because of this, it’s important that the appropriate qualified members are a part of the RBI team.
Sensitivity Analysis
It’s important to know which variables have the greatest effects on the risk calculation. Those variables will require the most scrutiny. Sometimes a difference of 10 degrees matters and in some cases it does not.
A sensitivity analysis involves reviewing the data to determine its influence on the risk. This analysis helps the RBI team determine what data requires the most accuracy. Of course, the ideal analysis would have all data perfectly accurate. However, that’s not practical and almost impossible to maintain. The sensitivity analysis helps the team determine which data to prioritize.
The key input data should be the primary target of future revalidation and evergreening, as it has the greatest impact.
Risk Presentation/Communication
There are a number of ways that risk can be presented. The key is to make sure it’s presented in a format that is easily understood by decision-makers. The most common presentation formats are risk matrices and risk plots.
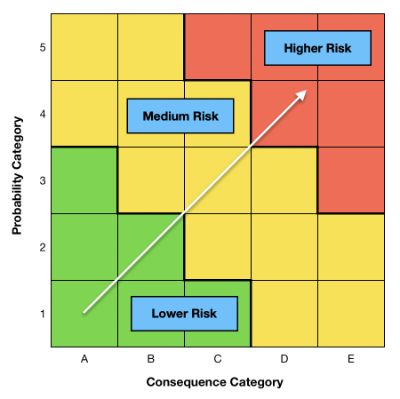
A risk matrix is a very effective way to visualize the distribution of risk throughout the plant or process unit, without using numerical values. This is typically shown with the probability on one axis and the consequence on the other axis. In the qualitative risk matrix example below, a five category probability and consequence is used to visually display the asset's risk. It’s also helpful to assign numerical values to the categories to provide guidance to the assessment team.
Qualitative Risk Matrix
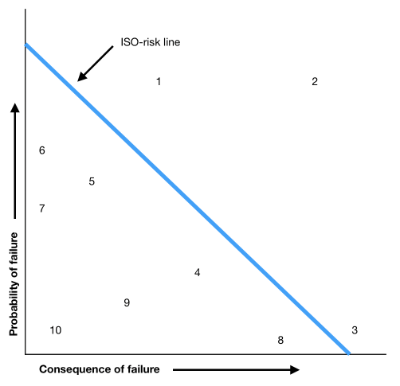
A risk plot is beneficial when a quantitative assessment is being utilized. This is a great visual tool for decision-makers to see in order to assist them with prioritizing risk mitigation strategies for assets. A risk plot has a similar layout to the risk matrix, with the added benefit of showing relative risk between assets. In the example below, notice that asset numbers 1, 2, and 3 are above the ISO-risk line and require mitigation strategies to bring them below the threshold.
Risk Plot
Whether using a risk matrix or plot, these tools help prioritize mitigation strategies across multiple assets in a plant or process unit.
Once a risk matrix or plot exists, a risk threshold needs to be established. The threshold typically divides the acceptable and unacceptable regions of the chart. What is an acceptable risk threshold? The risk threshold varies based on individual corporate safety and financial policies, as well as applicable laws and regulations.
Risk Management
With a risk threshold established, and a risk matrix or plot showing where each asset is in relation to the threshold; now it’s time to manage risk. Assets that are below the risk threshold are considered to have an acceptable risk and no mitigation or action may be required.
Assets above the risk threshold are considered to have an unacceptable risk. In this case, there are various mitigation strategies to consider. For example:
- Decommission: Can the equipment be taken out of service? By taking the equipment out of service, it’s no longer a risk.
- Inspection and repairs: Can the risk be reduced by performing inspections or repairs to the equipment? Is the risk driven by a high corrosion rate or cracking susceptibility that can be proved up with inspections?
- Consequence mitigation: Can anything be done operationally or by design to reduce the CoF? Installing emergency isolation valves and advanced detection systems help lessen the reaction time and reduce the volume lost, thus lowering the consequence.
- Probability mitigation: Can anything be done operational or by design to reduce the PoF? Upgrading metallurgy or altering operating conditions may minimize or eliminate the probability of the driving scenario.
Risk Management with Inspection Activities
Managing Risk by Reducing Uncertainty Through Inspection
A common misconception is that performing inspections will reduce risk. This is not always the case. Inspections are used to firm up the data used in the RBI analysis by reducing the uncertainty in that data. Performing inspections doesn’t stop damage mechanisms or prevent failures. They simply validate the data used in the analysis. Furthermore, it is presumed that any mitigation achieved through the results of inspections alone will be acted upon in a timely manner.
Identifying Risk Management Opportunities
As discussed earlier, typically a risk priority list is developed from the RBI process. Within this list, the primary (and sometimes secondary) risk drivers should be identified for each piece of equipment. It should be noted whether the risk is consequence driven or PoF driven.
There are limited means of mitigating risk for consequence driven equipment on-stream. Typically the only means of mitigation are through equipment or system design. Minimizing inventory volume is another way to reduce consequence, but that is usually controlled by the design of the equipment.
PoF driven equipment, on the other hand, can likely be managed through inspections and maintenance. The ability to mitigate risk through inspections is typically dependent on the type of equipment, credible damage mechanisms, and the accessibility to susceptible areas.
It’s also important to determine the potential reduction in PoF through inspections prior to performing the inspections. There are circumstances where inspections will have little to no effect on the PoF. In some cases, the equipment has a high corrosion rate that is well-established, or the equipment is near retirement. Inspections may not affect the PoF in these situations. Furthermore, failures that are instantaneous and are operation dependent, such as brittle fracture, may not be affected by inspections. It’s also possible, depending on the damage mechanism, that the inspection technology is not adequate enough to detect or quantify the damage.
The key takeaway is to recognize that inspection is not always a solution to reduce risk. Sometimes it is time to install cladding, repair, or replace the equipment, for example.
Establishing an Inspection Strategy
Now that the RBI results are available, an inspection strategy can be developed. The inspection strategy should be designed to work with other mitigation strategies (design changes, operational changes, etc.) to ensure the result of the mitigation plan will bring the equipment below the acceptable risk threshold.
With inspection strategies, it is important to select an inspection method that is sufficient in detecting the damage mechanism. For example, performing spot UT thickness readings on equipment susceptible to localized pitting will not be an effective inspection method. It is also important to establish when, where, and how much to inspect or address. Guidance on damage morphology and where to inspect should be provided by the corrosion specialist as part of the DMR.
Managing Risk with Inspection Activities
The effectiveness of past inspections is part of the reason for the current risk. If a more effective inspection had been performed in the past, the risk would likely be lower because of it. Looking forward, the future risk can be influenced by future inspections. Typically, RBI is used as a “what if” tool to plan future inspections and determine the subsequent risk. This process gives the organization a value of the inspection in the form of risk reduction.
When planning future inspections, there are a few key factors that contribute to the effectiveness of the inspection plan. The frequency of inspection, the amount of coverage, the inspection method, and whether the inspection is internal or external all play a part in the effectiveness of the inspection.
When it comes to choosing between an internal or external on-stream inspection, it’s important to recognize the advantages and disadvantages of both. External on-stream inspections can be very effective at identifying and quantifying damage without having to enter the equipment. However, the effectiveness relies heavily on the inspection method finding the damage without visual confirmation. Internal inspections, on the other hand, usually allow for visual confirmation of the damage; however, it should be noted that in some cases the prep work, shut-down, and start-up processes may cause deterioration and increase the risk of the equipment. For example, allowing moisture ingress into equipment may lead to stress corrosion cracking. There are also inherent shut-down and start-up conditions that may increase the risk of equipment that should be considered.
Managing Inspection Costs
RBI is a great tool for managing inspection costs. It allows the organization to focus resources on the equipment with higher risk and shift resources away from the equipment with little to no risk. This increases the overall inspection cost-effectiveness. It also allows for opportunities to perform non-intrusive inspections to provide sufficient risk reduction instead of having to blind, open, clean, and internally inspect. This may ultimately lead to longer runtime of a unit. Quantitative RBI tools should have the metrics/capability to compare risk reduction versus costs of each plan option.
Assessing Inspection Results & Determining Corrective Action
The inspection results should identify whether or not the susceptible damage mechanisms exist in the equipment. In addition, the rate of deterioration is important to document in order to determine the subsequent inspection strategy.
It’s important to compare the inspection results to the variables used in the RBI analysis in order to give credibility to the data. For example, if an assumed corrosion rate of 10 mills per year is being utilized on a piece of equipment but the inspection shows only a 3 mill per year corrosion rate, then it’s a great opportunity to update the data used in the RBI study.
Achieving Lowest Life Cycle Costs with RBI
Another benefit of using RBI is with life cycle cost analysis. Most plants are continuously changing the process conditions to de-bottleneck and create higher yields. These constantly changing operating conditions affect the RBI analysis.
Utilizing RBI for life cycle cost analysis can give backing to support metallurgical upgrades or design changes. For example, the analyst can assign a cost to continuous inspections required with the existing metallurgy. At some point in the life cycle, the cost of the inspection will offset the cost of a metallurgy upgrade that will not require the future inspection cost. This same philosophy could be used during the design phase of a project. When going through the material selection phase of a project, RBI can be utilized to show the future inspection costs of one material compared to another. In many cases, this is a great tool for justifying the upgrade on the front end.
Other Potential Mitigation Activities
As described earlier, inspections may not always provide sufficient risk mitigation or may not be the most cost-effective method. There are other methods that may reduce risk by reducing the CoF, reducing the PoF, enhancing the survivability of the facility, or mitigating the primary source of the consequence.
The sections that follow outline some of these activities.
Equipment Replacement & Repair
When equipment deterioration has reached a point that the risk of failure cannot be managed to an acceptable level with inspection, operation, or other means; then repair/replacement is often the only way to mitigate the risk.
Fitness-for-Service Assessment
The RBI inspections may identify flaws in equipment that may require a Fitness-For-Service assessment per API 579. This assessment can determine whether or not the equipment may continue to be safely operated, and it may also be used to determine what size flaws would require repair in the future.
Equipment Modification, Redesign, & Rerating
Modification and redesign of equipment can minimize or mitigate PoF. Changes in metallurgy, linings, coating, increased corrosion allowance, physical design changes, and insulation improvements are a few examples.
Emergency Isolation
Installing emergency isolation valves can reduce the CoF by minimizing the volume lost in a leak event. Having the ability to remotely operate an isolation valve in a timely manner, during a release, will usually significantly reduce risk.
Emergency Depressurizing/Deinventorying
Similar to emergency isolation, emergency depressurizing/deinventorying can greatly reduce the volume lost, thereby reducing CoF.
Modify Process
Changing the process conditions to be less hazardous is another way to reduce risk. For example, reducing the temperature of a process to below the boiling point to eliminate flashing or substituting a hazardous material for a similar but less hazardous material are ways to reduce risk by modifying the process.
Other process add-ons can contribute to risk reduction, such as adding a water wash to reduce corrosive salts from forming or adding a corrosion inhibitor.
Of course, these solutions are not always economical; however, this is where the life cycle cost analysis using RBI becomes a factor.
Establish Integrity Operating Windows
IOWs should be established for process parameters that could impact the integrity of equipment if not properly controlled. Typical IOWs include temperatures, pressures, pH, flow rates, etc. Reference API RP 584 for more information on IOWs.
Reduce Inventory
Reducing inventory simply reduces the magnitude of consequence. This can be managed in many ways, but the concept is simple. Less volume available equates to less potential volume lost in a leak event.
Water Spray/Deluge
This method is typically used to reduce fire damage or prevent escalation. A properly designed system can greatly reduce the probability of a BLEVE.
Water Curtain
Water curtains are used to contain airborne toxins or flammables. The key is early activation to reduce the amount of toxins or flammables that get outside of the curtain. The curtain should be designed such that it primarily restricts the process from reaching ignition sources or personnel.
Blast-Resistant Construction
Blast-resistant construction provides protection from explosions. It provides personnel protection as well as protection of critical and emergency response assets. Refer to API 752 for more information.
Other Mitigation Activities
Other mitigation activities include spill detectors, steam/air curtains, fireproofing, interlock instrumentation, facility siting layout, shelters (safe havens), among others.
Reassessments
Reassessment are vital to maintaining an updated RBI database. When an RBI analysis is performed, it is performed using the data and knowledge at the time of the assessment. The data is a snapshot in time. Changes to the process conditions are inevitable, and the RBI assessment should be updated after each change. These changes can have significant impacts on the RBI risk analysis.
In an ideal scenario, an RBI program should have completely evergreened, accurate, and up-to-date RBI data in order to provide the most accurate analysis. Unfortunately, the evergreening process may be difficult to maintain, considering the number of variables included in the assessment. At a minimum, every site should establish criteria for when to conduct an RBI reassessment. The following sections define some of these criteria.
Damage Mechanisms & Inspection Activities
Inspection activities are a way to firm up the projected deterioration rates to become more accurate. Since many damage mechanisms are time dependant and the rate of deterioration in RBI is set as a constant rate, it’s necessary to confirm those rates over time to shift the rate higher or lower based on findings.
Some damage mechanisms are independent of time and only occur with specific operating conditions. It’s important to reevaluate the RBI assessment for these damage mechanisms when specific operating conditions have been met or when IOW exceedances have occurred.
Process & Hardware Changes
Typically, process and hardware changes warrant a revalidation of the RBI assessment for the affected equipment or units. Changes in process conditions can greatly affect the outcome of the RBI assessment and therefore should be revalidated after every change.
Hardware changes can have an effect on both PoF and CoF, depending on the change. For example, upgrading the metallurgy of equipment may decrease PoF; whereas relocating equipment to a remote location may decrease the CoF.
RBI Assessment Premise Changes
The following are possible changes that could trigger an RBI Reassessment:
- Increase or decrease in population density
- Metallurgy or design change
- Change in product values
- Safety and environmental laws change
- Change in risk criteria
- Feed/composition changes
- Run length changes
- Changes in inspection codes/standards
The Effect of Mitigation Strategies
When strategies are implemented to mitigate risk, it’s important to verify that the completed strategy has delivered the expected risk result. Once the strategy is implemented a reassessment of the risk may be performed to update the RBI program with the new data.
When to Conduct an RBI Reassessment
As discussed earlier, there are significant changes that could trigger an RBI reassessment; however, If there are no events that trigger a reassessment, a set of mandated reassessment terms should be established. For example:
- After significant changes: addition of equipment, revamps, etc.
- After a set time period: default maximum interval in case no significant changes are made.
- After the implementation of risk mitigation strategies: as described earlier, this is necessary to ensure the mitigation strategy had the expected outcome on the risk result.
- Before and after maintenance turnarounds: many inspections and activities take place during a turnaround. It’s important to update the RBI assessment with all findings, changes, etc. discovered. Performing reassessment before turnarounds may help drive inspection strategies that save onstream inspection costs in the outlying years.
This project is a collaborative effort between Inspectioneering and The American Petroleum Institute. Click below to learn more about API's Individual Certification Programs.