| This article is part 2 of a 2-part series. |
| Part 1 | Part 2 |
Introduction
Part 1 of this two-part series on troubleshooting vibration of an overhead piping system (published November/December 2022) detailed the overall assessment methodology along with the qualitative, quantitative, and visual assessments which laid the foundation for the specialized predictive techniques presented in this article.
Specialist Measurement Techniques (TM-07 and TM-08)
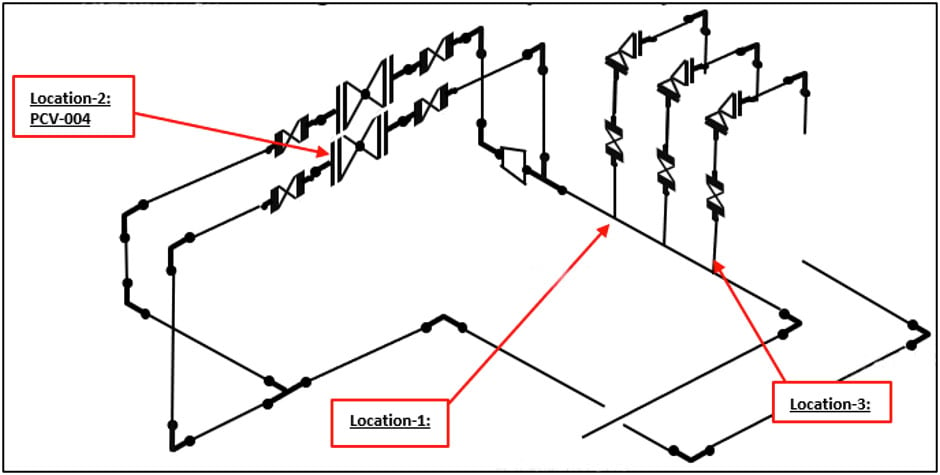
Vibration measurements were taken in the field during each of the throughputs of 225 MBD, 245 MBD, and 250 MBD, and compared for the three locations shown in Figure 1.
The velocity readings give a more uniform weighting over the required range and are most directly related to the resulting dynamic stress. They were therefore used as vibration measurements for the analysis, as shown in Tables 1, 2, and 3 [1]. The piping vibration criticality assessment and velocity graph for the above readings were plotted as shown in Figure 2. From this plot, the nature of the vibrations was found to move from the “Acceptable” region during the normal flow rates at 225 MBD to the region of “Concern” at 250 MBD.
| Flow | 250 MBD | 245 MBD | 225 MBD | |||
| Spectrum | RMS in/sec | Hz | RMS in/sec | Hz | RMS in/sec | Hz |
| Horizontal | 0.2434 | 8.7500 | 0.1852 | 8.7500 | 0.1688 | 19.380 |
| Vertical | 0.2506 | 6.8750 | 0.1981 | 6.8750 | 0.2307 | 8.750 |
| Axial | 0.1314 | 8.7500 | 0.0906 | 19.3800 | 0.0852 | 19.380 |
| Flow | 250 MBD | 245 MBD | 225 MBD | |||
| Spectrum | RMS in/sec | Hz | RMS in/sec | Hz | RMS in/sec | Hz |
| Horizontal | 0.0725 | 5.0000 | 0.0639 | 5.0000 | 0.0631 | 5.000 |
| Vertical | 0.0918 | 5.0000 | 0.0585 | 5.0000 | 0.0561 | 8.750 |
| Axial | 0.0750 | 4.3750 | 0.0553 | 3.7500 | 0.0519 | 4.3750 |
| Flow | 250 MBD | 245 MBD | 225 MBD | |||
| Spectrum | RMS in/sec | Hz | RMS in/sec | Hz | RMS in/sec | Hz |
| Horizontal | 0.2679 | 8.7500 | 0.2008 | 8.7500 | 0.1995 | 8.750 |
| Vertical | 0.2478 | 5.0000 | 0.1984 | 5.0000 | 0.1789 | 5.000 |
| Axial | 0.0948 | 6.2500 | 0.0773 | 8.7500 | 0.0793 | 18.750 |
The most significant factors were attributed to the increased flow rates due to debottlenecking studies being carried out on gas condensate fractionation plants, resulting in higher flow velocities with a correspondingly greater level of turbulent energy in process systems. The excitation was found to be broadband (i.e., energy is input over a wide frequency range) in our case, as shown in Figure 3.


Comments and Discussion
There are no comments yet.
Add a Comment
Please log in or register to participate in comments and discussions.