Introduction
Radiography is one of the most widely-used nondestructive examination (NDE) methods to ensure structural integrity of components before putting them into service. Conventional film radiography has been in use for several years, but the technology suffers from a drawback that, since images are fixed and non-adjustable, post-processing is not possible without conversion to a digital format. With the advent of digital technology, image processing can be done in digital radiographs which can be used for automated detection and quantification of defects. In the development of such automated systems, it is important to know the limitations and the probability of detection of the system. Digital radiographs may need some digital processing such as contrast enhancement, noise reduction, etc., before interpretation. Filters can be applied to enhance and extract features from the image (Figure 1). However, these techniques are applicable only if the “as captured” radiograph has recorded the features. This article attempts to compare the probability of detection in the two different digital radiography systems.
Experimental Procedure
Radiographs were obtained using both digital radiography with a flat panel (FP) and computed radiography techniques with an image plate (IP). The experiment involved radiography of a standard reference stainless steel (SS) plate of 10mm thickness, containing defects in the weld region. The source-to-film distance (SFD) was fixed at two feet for all the radiographs. Wire type penetrameters of DIN standard (wires 6 to 16) were used during exposure. X-ray from a microfocus system with tungsten target was used as the source. The focal spot was measured experimentally and was approximately 50 µm. The FP detector that was used consisted of a 2D array of sensors, approximately of the size 200µm. For computed radiography, a high-definition computed radiography (HDCR) image plate was used for capturing the radiograph and it was scanned using a laser beam of width approximately 80 µm.
Image Processing for Digital Radiography
Image processing techniques were applied on the digital radiographs for improved response during signal processing. Noise is considered any unwanted disturbance that masks the signal. Sensitivity is a measure of the smallest geometrical detail that can be resolved in a radiograph. Sensitivity is affected severely by the presence of noise. In order to reduce noise in a digital image, various noise filters are usually applied. Filters are broadly classified as low-pass and high-pass filters. Low-pass filters allow the low frequency (i.e., background details of the image) through them. These filters are mainly used in noise removal applications. High-pass filters allow high frequency components (i.e., edges) to pass through them. It is mainly applied for edge enhancement purposes (Figure 1). The type of filter to be used is governed by the type of frequency to be removed from the frequency spectrum.
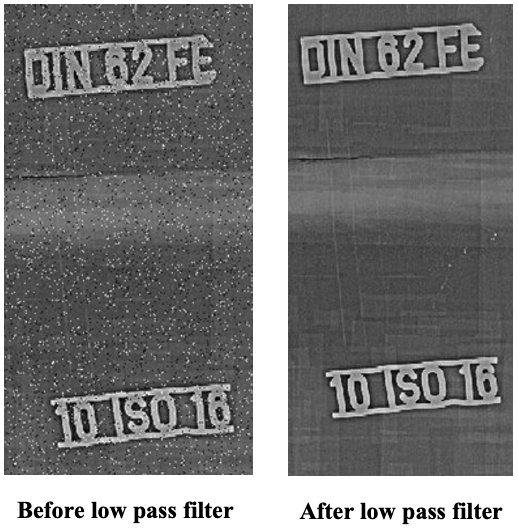
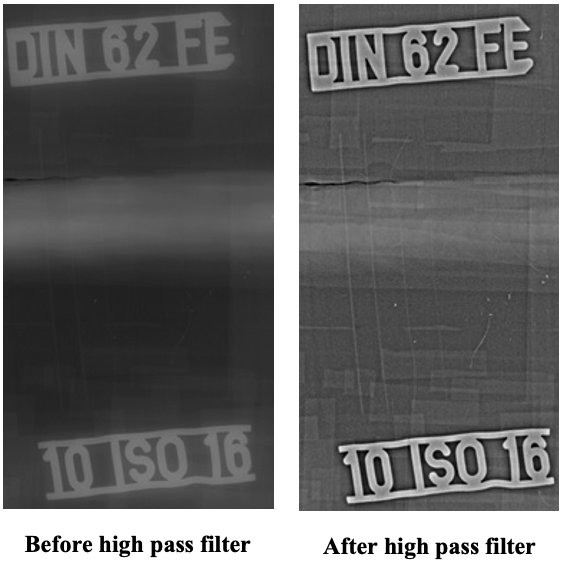
Figures 1 and 2 show the result of the application of filters to the original image. As shown, the low pass filter reduces the noise and yields a better output [2]. The high pass filter, shown in Figure 3, has highlighted the edges and hence the visibility is improved.
After image processing, the thinnest wire visible in all the images was identified. Gray value intensity versus distance profiles were drawn across wires. A signal-to-noise ratio was calculated from the intensity profile. For the two systems under consideration, probability of detection (POD) curves were generated. For the POD study, 40 radiographs were taken in both the systems. The “hit/miss” criteria (which is explained further) was used to estimate an approximate POD curve.


Comments and Discussion
Add a Comment
Please log in or register to participate in comments and discussions.