Introduction
Numerous statistical tools and techniques can be applied once corrosion loops have been accurately established. Statistical calculations offer appropriate means to model and analyze corrosion data (pH, exposure time, and corrosion rates among others). The modeling process usually starts by analyzing the association between the variables and continues with formal modeling once an association is apparent. A better understanding of the results can be obtained when the results of the data analysis are combined with statistical plots.
Purpose
The main intention of this article is to introduce the Response Surface Methodology (RSM) using some of the elements of critical thinking as a guide. This methodology is not often used in the industry, but can be widely used by corrosion/process engineers to identify hot spots where local maximums of corrosion rates exist. Minitab, a commonly used statistical package, has been used to model the data and generate plots (Optimization and Contour Plots). However, the user can utilize other statistical packages, such as JMP and R, to perform an identical statistical analysis.
Question at Issue
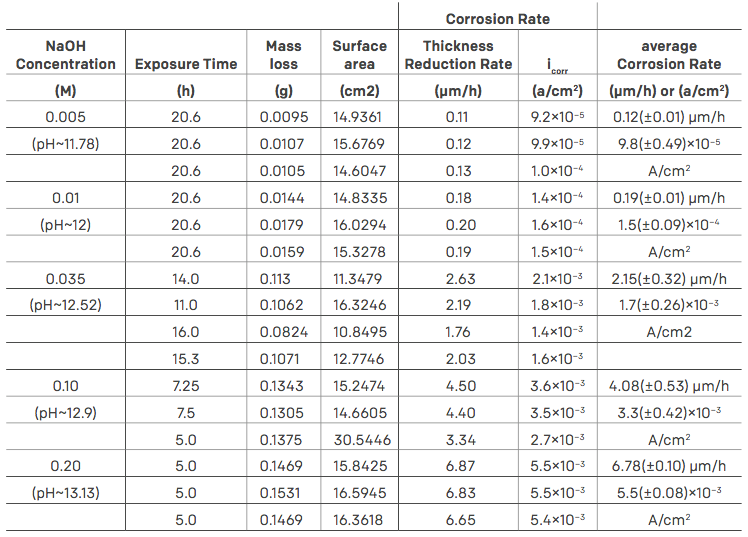
Corrosion and process engineers face the challenge of identifying the relationship and establishing trends between various process variables that can affect the integrity of an asset, such as pH, exposure time, and rates of corrosion. The data for our investigation is provided in Table 1. We will only utilize the variables pH (predictor), exposure time (predictor), and corrosion rates (response) highlighted in blue in Table 1 in our model. As an example, let us consider a second order model in two predictor variables.


Comments and Discussion
Add a Comment
Please log in or register to participate in comments and discussions.