Industrial operators want to ensure their equipment runs as efficiently and effectively as possible. While maintenance is necessary and systematic failures are possible, implementing a Risk-Based Inspection (RBI) program can help reduce the likelihood that a piece of equipment will fail at a given time. Through the gathering of key data, RBI is used to identify, quantify, and manage risk, and can also be used to prioritize inspection-related activities. By following some key recommendations, it’s possible to improve the probability of failure (POF) calculations to make them more accurate. More precise POF calculations can result in a better quantification of risk, more effective risk management, and a better allocation of limited resources where they are most valuable.
While many organizations have already implemented an RBI strategy, the data is only as good as its evaluation. This data can be used to create a probabilistic evaluation called Lifetime Variability Curves (LVCs), which blend subject matter expectation experience and guidance with data.
LVCs are dynamic models that predict asset failure through the application of data science principles. Like a hurricane tracker, as more data points are collected, the model quantitatively updates and provides a statistical distribution that becomes more accurate as more data is entered. This statistical distribution can then be measured to understand the level of uncertainty, POF, and ultimately, the risk of any component or asset. Additionally, LVCs can be used to understand the asset’s likely end of useful life.
Evaluating Thinning Risk
The examples below in Figure 1, demonstrate how LVCs resemble hurricane charts because their band of uncertainty can present similar to a hurricane prediction cone and change with the influx of data.
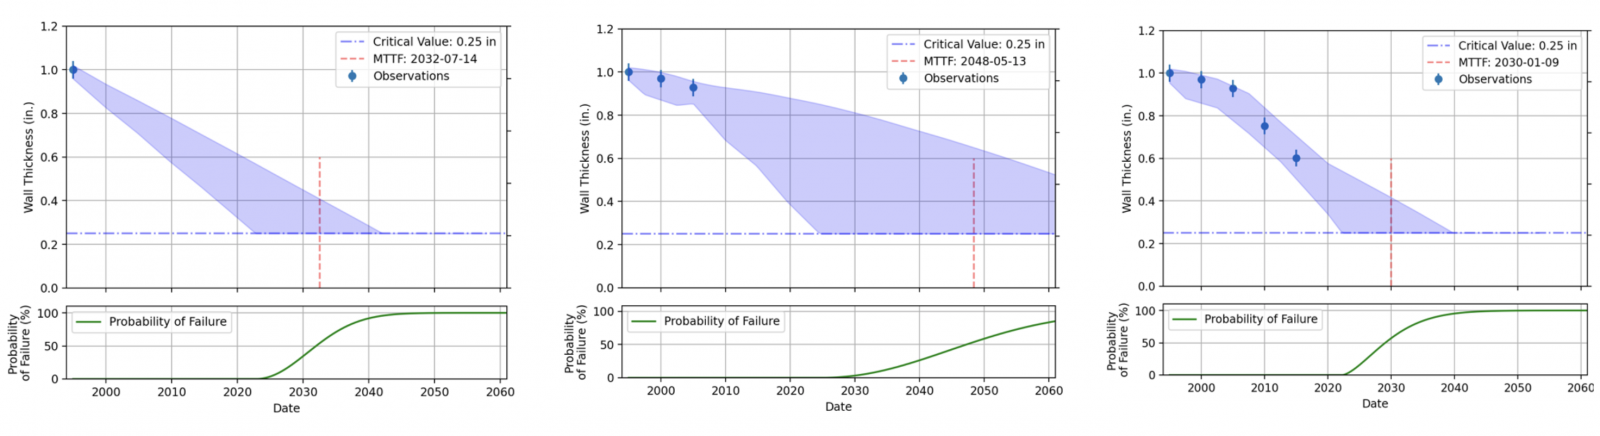
The LVC on the left illustrates the subject matter expert (SME) defined degradation rate and starting thickness of an asset. As additional data is collected and the model is updated, as illustrated in the middle, the new model results in an increased expected life and a higher level of uncertainty. As more data is collected and is modeled in the third LVC, we see the trend shift to align with SME expectations, resulting in more certainty on the asset’s expected end of life and POF for the asset. LVCs continue to adjust and provide a better understanding of the POF profile, and this information can be used for inspection planning and overall recommendations for managing risk.
API 581 vs. LVC
Looking at the API 581 thinning model and the LVC approach, they are both comparable, however, there is more precision and accuracy with the LVC approach. API, by design, leans more conservative and can skew the POF earlier in the equipment’s life to prompt inspection. With both methods, as inspections are performed, there’s higher confidence in the equipment, but as time goes on, that confidence decreases.
In Figure 2, API’s POF increases earlier than the LVC curve. Because the API curve is more conservative, it’s shifted to the left. After an inspection is performed, the risk flattens out and then starts to increase again after a period of time where an inspection is not performed.
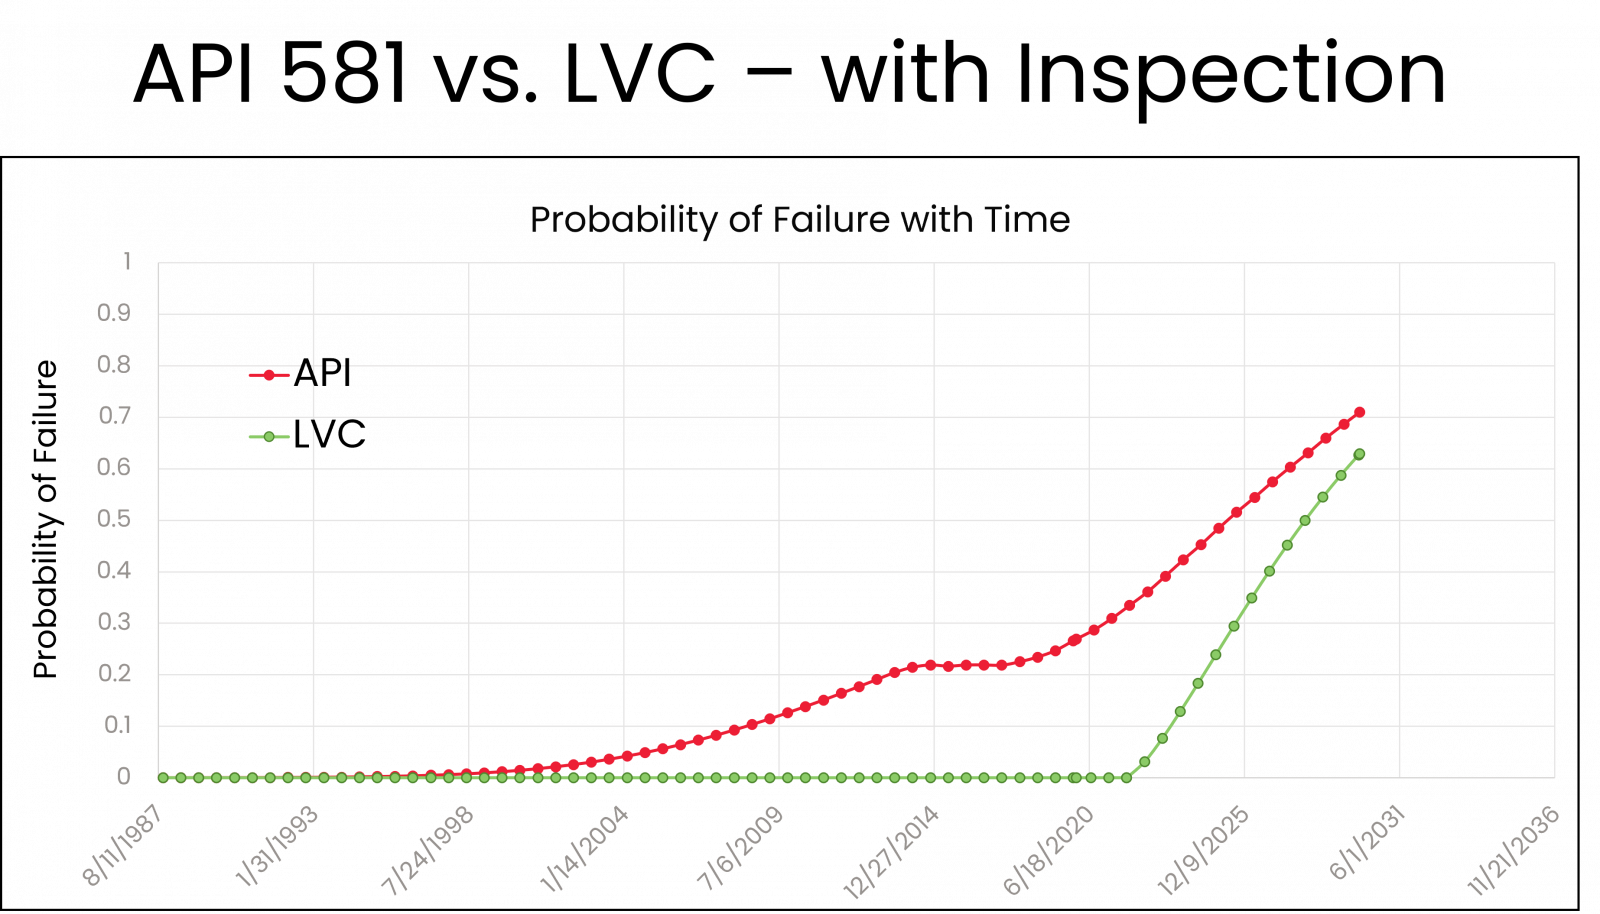
In a case when there is trustworthy data that matches initial expectations, the LVC is going to tighten quite rapidly meaning there is high confidence on a much smaller time range when failure is expected. In those cases, inspection adds less value and there is an opportunity to work with other departments to consider performing targeted maintenance activities.
In a case where there is a high level of uncertainty, the LVC is going to widen and inspection is prioritized to better understand degradation and its variability, better informing maintenance activities or alternative risk mitigation strategies.
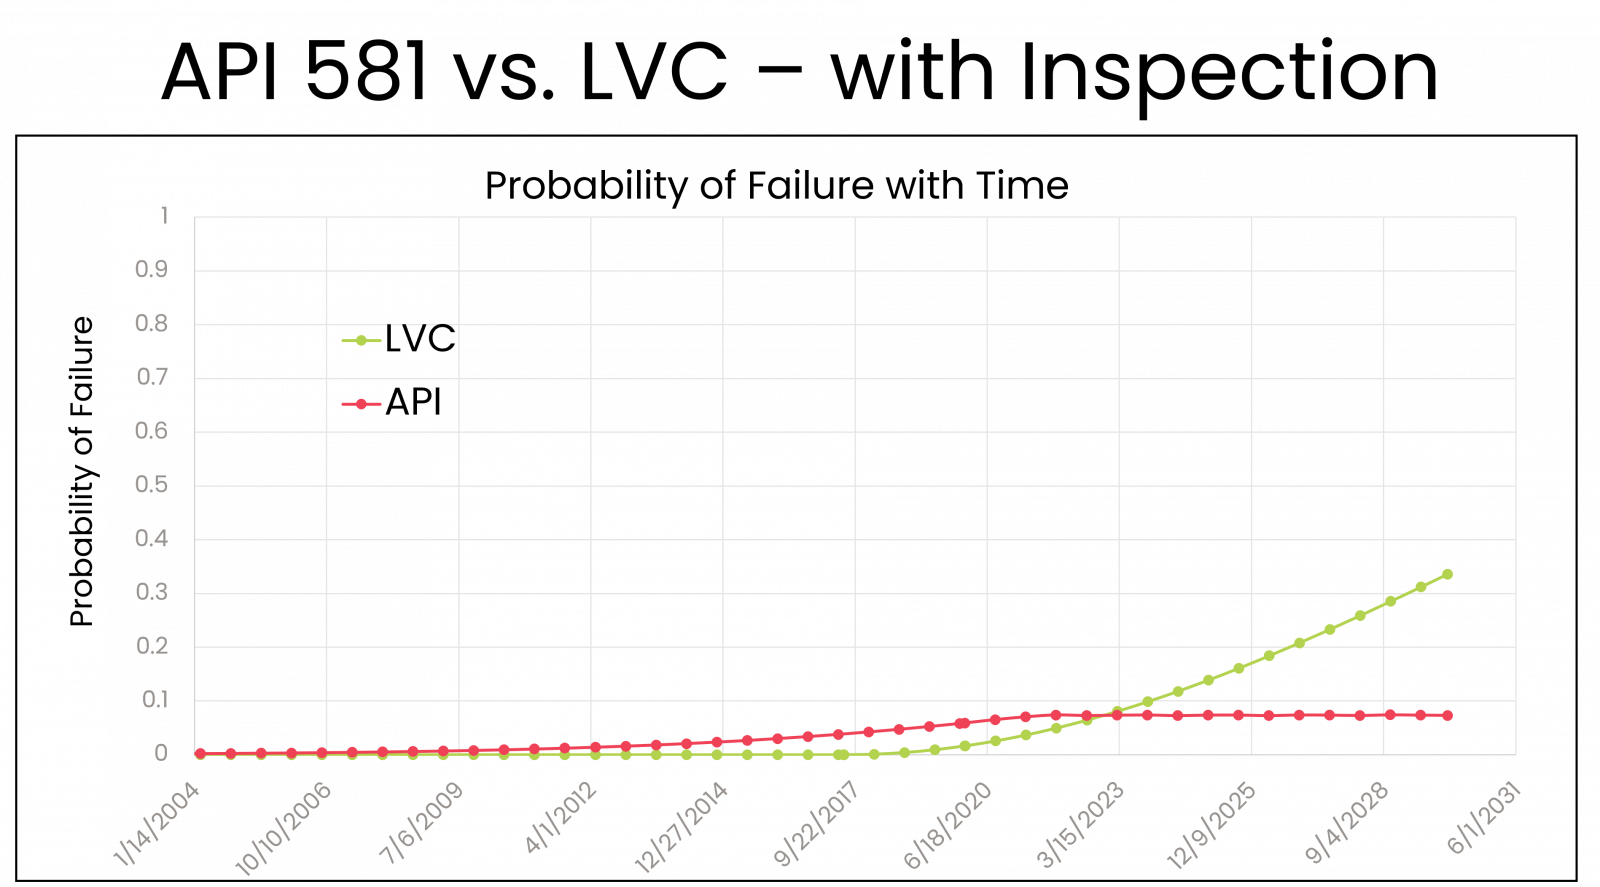
In Figure 3, the API curve indicates an earlier POF than the LVC. In order for you to change the trajectory of your probability increase, you would have to adjust your corrosion rate or your thickness as a result of that inspection. In this case, the inspection indicated a higher rate of corrosion than was originally projected and the LVC corrected its band of uncertainty to move the probability of failure up sooner. In this case, API projections are less conservative than in Figure 2.
Recommendation and Benefits
An approach such as LVC can help enhance API 581 POF calculations for thinning. This method has proven to increase accuracy, precision, and has the flexibility to handle one-off cases that are handled manually today. However, the intention is not to devalue SMEs with data science. SMEs should provide context to the data analysis, identify useful data, support identification of root cause, and develop the best solutions to address the problems.
The bottom line is that once the investment has been made in RBI, it’s important to leverage inspection data as best as possible to extract as much value out of the program. It’s essential to quantify uncertainty of inspection data rather than making a variety of assumptions that don’t match reality. Data and analysis need to match what’s actually happening in the field as much as possible so the best management decisions can be made.
To dive more thoroughly into maximizing RBI programs and step-by-step recommendations on how to take your existing RBI program to the next level, check out the webinar, 4 Ways to Get More from Your Risk-Based Inspection Program.


Comments and Discussion
There are no comments yet.
Add a Comment
Please log in or register to participate in comments and discussions.