An inspection aims to collect meaningful data to reduce uncertainty and better model what’s happening in the field to make more prescriptive and less subjective decisions. Risk-Based Inspection (RBI) is a proven asset integrity management method for prioritizing inspection activities, identifying and understanding risk drivers, and creating effective risk mitigation strategies. For complex processing industries, like refining, midstream, and chemicals, knowing where to focus inspection spend, when to perform inspections, and which methods will provide the most confidence in understanding an asset’s current state is crucial. This information helps facility leaders prioritize inspection budgets and reduce loss of containment events.
RBI has been widely adopted for about 10-15 years. While reliability technologies have helped the industry become not only more reliable, safer, and more cost-effective in deploying resources, many owner/operators feel like they’ve realized the initial value of their programs and are looking for ways to recognize more value. Facilities that eliminate wasted reliability spend and maximize asset performance are more successful, so what are the next steps to further improve and optimize the availability, risk, and cost of RBI programs?
This blog will dive into the “next steps” of maximizing RBI programs, specifically how to better quantify the value of inspections and improve inspection handling.
Quantify Inspection Value – More Prescriptive, Less Subjective
Current practices for grading inspection history and recommending future inspections are relatively qualitative compared to other RBI calculations. To improve the results and value of an RBI program, facilities should use a more quantitative and objective method for determining historical inspection credit, quantifying risk, and inspection recommendations.
One method facilities can implement to increase the value of inspections is Quantitative Task Effectiveness (QTE). QTE quantifies the economic value of every inspection, maintenance, repair, or replacement activity and supports more prescriptive decisions, removing subjectivity to better quantify uncertainty. In addition, QTE provides specific inspection guidance and results to be used during the implementation of the inspection plan. If inspection findings are significantly different from expected (better or worse), coverage can be adjusted to react to the actual results to minimize uncertainty.
Best practice recommendations combine data science techniques with Subject Matter Expert (SME) knowledge to quantify historical inspections and provide more prescriptive inspection recommendations. The benefits are four-fold:
- Eliminates subjectivity of risk-based programs
- Gives specific rather than generic recommendations.
- Provides inspection recommendations based on expected and actual results.
- Enables focus of limited resources to areas where they add the most value.
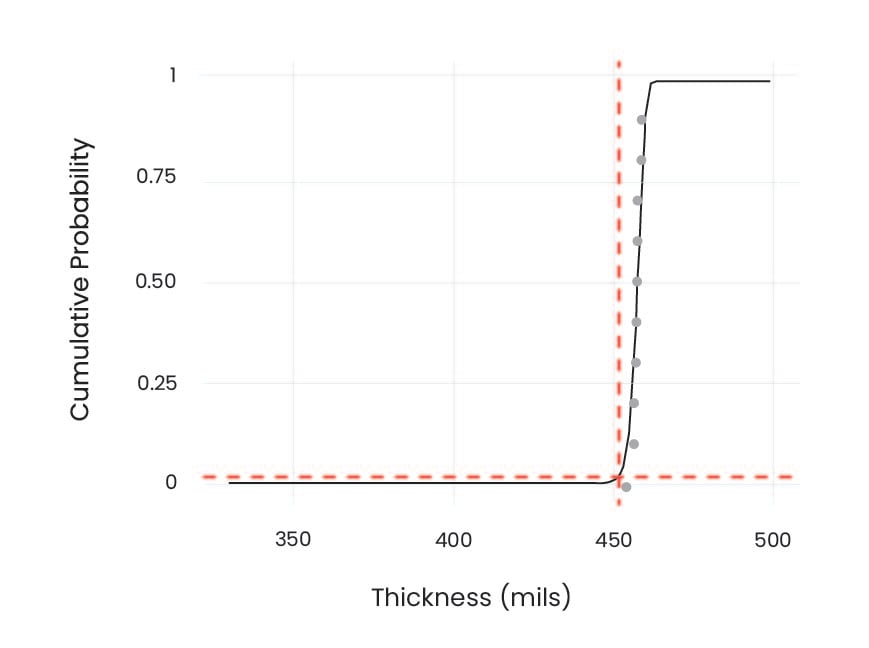
For example, data science techniques can be combined with subject matter expertise for cases of local degradation. One approach used to model local degradation is Extreme Value Analysis (EVA). EVA leverages available inspection data to estimate the amount of degradation that has potentially occurred on uninspected portions of an asset. Additionally, EVA can help facility leaders prioritize additional inspections in cases where there’s less certainty surrounding the data. In some cases, however, EVA can be overly optimistic or pessimistic depending on the data provided to the model. In overly optimistic instances where a facility may not have much data indicating local damage due to ineffective inspection techniques or coverage, EVA can result in little expected degradation. In this case, Figure 1 shows a standard EVA that indicates a lower amount of degradation. However, because only a small portion of the susceptible area of the asset has been inspected, this EVA may give facility leadership a false sense of confidence.
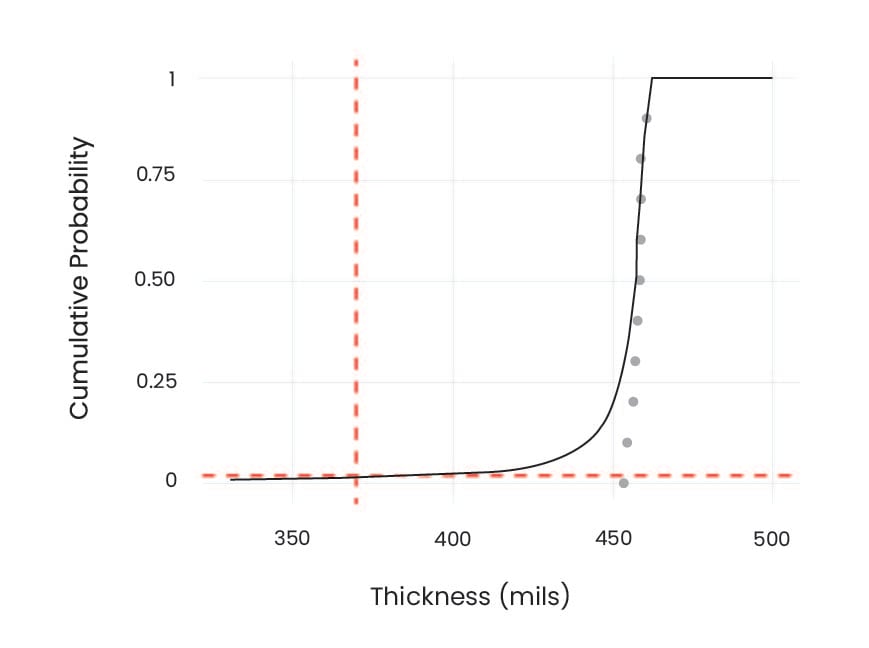
Facilities can blend data science techniques with subject matter expertise to create more accurate predictions through Bayesian EVA. Figure 2 displays the Bayesian EVA and combines the data from Figure 1 with subject matter expertise to make a more precise assumption about the degradation level. In this model, SMEs can evaluate the asset’s low corrosion history and quantify the probability that the amount of degradation is significantly worse than expected. As a result, the Bayesian EVA will drive more inspection to confirm whether or not the amount of degradation is as low as predicted.
Optimizing Inspection Planning by Improving Inspection Handling
The current industry approach to inspection planning uses risk modeling over time against a defined risk target to determine inspection recommendations. Considerable value can be created using a task optimization approach that balances the impact of HSE risk, system availability, and cost of the activities to quantify the benefit-to-cost ratio. Expanding the scope of asset strategy optimization to include these metrics will help facilities better allocate limited resources to areas where they make the most impact and, ultimately, will enable a more effective inspection program.
Best practice recommendations use a balanced approach that does not rely solely on risk but considers multiple elements, including availability, cost, and HSE risk. The benefits of this include:
- Improvement of inspection recommendations with task optimization
- Ability to understand and quantify alternative strategies to inspection through simulation. Other alternatives to inspection might be:
- Repair/replace in kind
- Upgrading metallurgy
- Addition of corrosion inhibitor
- Implementation of integrity operating windows and process controls
Conclusion
While RBI is widely used and implemented, facilities need to continue to address the challenge of meeting an increasing demand for products with their current assets. There are still opportunities to update and improve the existing technology through data-driven approaches.
To dive more thoroughly into maximizing RBI programs and step-by-step recommendations on how to take your existing RBI program to the next level, check out the webinar, 4 Ways to Get More from Your Risk-Based Inspection Program.


Comments and Discussion
Add a Comment
Please log in or register to participate in comments and discussions.