Introduction
With the leaps and bounds made with data collection and analysis technologies in recent years, machine learning (ML) and “Big Data” technologies are proving to be powerful tools in many industries—including the oil and gas refining space. Pinnacle recently completed a study comparing the accuracy of asset degradation rates predicted by a ML model to the rates predicted by a human subject matter expert (SME) applying current industry standards. Specifically, this analysis examined how accurately asset degradation in refinery reformer units could be predicted. In short, ML models were able to predict degradation rates and associated variability with a higher level of accuracy and reduced the mean absolute error by 38% compared to existing industry standard practice and SME estimation. The results of the analysis demonstrate the exciting possibilities for how “Big Data” can be used to empower the reliability and corrosion engineer to solve real-world reliability challenges faster and more accurately than current industry practices.
What is Machine Learning and How Can it Improve Reliability?
Machine learning is a method of data analysis in which advanced algorithms are able to recognize patterns in data and learn from those patterns without being explicitly programmed. As time goes by and data is collected, machine learning algorithms analyze parameters in the data to do things such as predict future events and provide proactive warnings against undesirable scenarios.
Though most facilities now have an abundance of data available, many struggle to make reliability decisions with confidence for this very reason. An overabundance of data, coupled with a lack of technological systems capable of both analyzing large amounts of data and effectively integrating insights with reliability management systems, prevent facility leaders from being able to utilize all of the data collected to optimize reliability strategies and gain trusted insights.
This is where a data-driven, machine learning approach can come in. Machine learning, applied in the right context, can help reduce uncertainties in reliability models, allowing leaders to focus on the uncertainties that cannot be modeled and make more confident decisions as a result. By using machine learning, asset degradation modeling can become much more accurate, which can have a profound impact on the results and recommendations output from a risk-based inspection (RBI) program or other quantitative approaches to reliability management and performance optimization.
Degradation Prediction Accuracy: Comparing the Data-Driven Model to Current Industry Standards
The goal of this study was to use a data-driven ML model to accurately predict degradation rates for assets in reformer units and to compare the accuracy of the ML model to current industry practice. The study leveraged a data set collected from 37 reformer units to be used for both the ML model and for the application of current industry standards. The data set included information such as inspection history, asset attributes, process stream data, and assigned damage mechanisms.
The Data-Driven Model: How it Works and How it Differs from Current Industry Practices
ML models are different from current industry practices in that they are not explicitly coded with rules. Conversely, the American Petroleum Institute’s (API) recommended practice, API RP 581, Risk-Based Inspection Technology, provides recommended procedures and methodologies to be applied for an RBI program.
Instead of being rule-based, ML models are fed data that will help them recognize patterns and make informed predictions. For example, to predict future degradation rates, models are fed data that describe a given asset or component (operating conditions, process stream data, etc.) along with the measured degradation rates. They then use this data to learn how different variables impact degradation rates. Once they learns these patterns, they can make accurate predictions. For example, they can recognize that higher temperatures generally coincide with higher degradation rates without being directly coded to know this information.
To compare, consider hydrochloric acid (HCl) degradation, which can be modeled by using the methodology found in API RP 581 or the expertise from a materials and corrosion engineer. According to API RP 581, HCl degradation is modeled as a function of an asset’s metallurgy, temperature, pH, etc. Materials and corrosion engineers typically use this information, in addition to a wealth of experience, to estimate degradation rates. Instead of following a prescribed set of rules, such as those found in API 581, an ML model uses all available and pertinent data to learn how to deal with common situations.
Study Results
To compare the accuracy of such a ML model, two examples demonstrate the differences in results between a ML model and current industry practices. The first is a comparison of degradation rates for a drum compared to the ML model and industry approaches. The second example looks at the accuracy of predicting degradation rates for over 10,000 assets.
Example 1 – Drum Degradation Modeling
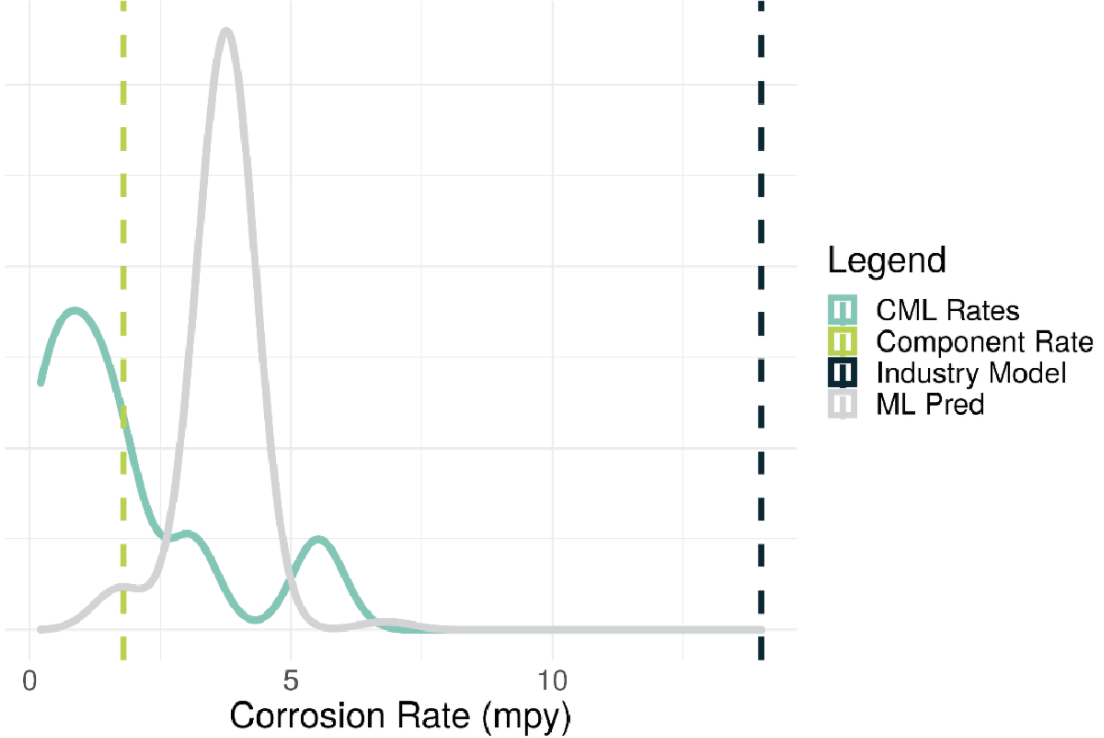
The graph below illustrates degradation modeling for a drum from one operator in the dataset. The teal curve represents the actual observed degradation at the Condition Monitoring Location (CML) level. The grey curve shows the degradation rate distribution calculated by the ML model. The degradation distribution generated by the ML model indicates that rates around 4 mils/year are likely, whereas rates greater than 7 mils/year are highly unlikely.
In comparison, the green vertical line represents average degradation rates of 2 mils/year and the blue vertical line represents the degradation rates generated by the standard industry approach (API 581 tables), which were around 18 mils/year.
When comparing the ML model’s predictions to those provided by the standard industry approach, the ML model proves to be much closer to the real historical measurements and the industry approach provides high levels of conservatism.
Example 2 – Component Degradation Modeling
The second example compared how the ML model fared against the standard industry approach to predict degradation rates for a set of components more accurately. In this experiment, thousands of assets were randomly selected and removed from the training set of data, comprised of over 10,000 assets worth of data, which is used to train the ML model. The data was removed so that the ML model could use the remaining data to “learn” and then generate predicted degradation rates for the 11 components whose data was removed, which could then be compared to the actual degradation rates measured.
After the ML model was trained with the remaining dataset to generate degradation rate predictions, it was compared to the results of materials and corrosion subject matter expert (SME) predicting degradation rates (using API 581 tables) for assets using the same data set. The ML model and the SME were given identical data to provide a fair and unbiased testing environment.
Comparing the predicted degradation rates to the measured degradation rates resulted in a mean absolute error of 5 mils/year for the industry standard approach and 3.1 mils/year for the ML model. This means that compared to standard industry practice, the ML model achieved a 38% reduction in mean absolute error.

In addition to providing greater accuracy, the ML model can also be run in real-time on a large volume of assets, enabling rapid implementation and continuous evergreening as new data is made available. This benefit provides opportunities to evaluate changes in degradation as a result of constantly changing process conditions—for example, during an integrity operating window (IOW) excursion or if an owner/operator needed to quickly simulate the potential impacts of a change in feedstock.
Conclusion
In both experiments, the data-driven ML model more accurately predicted degradation rates when compared to predictions derived from current industry practice. By using data-driven, inference-based learning, ML models are able to make better, more informed predictions in real time. The results of this study demonstrate the exciting opportunity for the industry to apply data analytics to reliability and identify potential threats sooner, improve predictability, and focus limited resources to drive facility-wide reliability improvement.


Comments and Discussion
There are no comments yet.
Add a Comment
Please log in or register to participate in comments and discussions.