What if you could quantitatively measure the future impact of different scenarios at your facility before they actually occurred? With Quantitative Reliability Optimization (QRO), you can simulate different actions to better understand how they impact your system’s overall performance in real-time. This could include things like changes in feedstock, field upgrades, adding sensors to critical assets, pushing out a major turnaround, or major adjustments to inspection and maintenance activities and resources.
Acting as a reliability twin, QRO is a new dynamic reliability approach that bridges existing first principles-based reliability models with advanced data science principles and system-based optimization to drive improved facility performance. As a result, facilities can strategically balance availability, process safety, and spending performance.
There are four elements of QRO:
- Asset Risks Analysis (ARA)
- Lifetime Variability Curve (LVC)
- Forecasting System Availability
- Reliability Simulation and Performance Optimization
In our previous blog, Combining First Principles and Data Science to Drive Reliability Performance: Quantitative Reliability Optimization (QRO), we discussed how an ARA creates a causal link between assets' functions, failure modes, and failure mechanisms, as well as how an LVC predicts asset failure using advanced statistical analysis. In our most recent blog How Many Reliability Leaders Can Answer This Question, we reviewed how linking an ARA and LVC functionality to an overall system model can help forecast a facility’s availability more accurately.
The fourth element of QRO, Reliability Simulation and Performance Optimization, is the final step in moving forward the reliability digital twin. With reliability simulation, facilities can drive reliability performance by updating design, optimizing inspection and maintenance activities, and adjusting operational strategy based on real-time data.
What is Reliability Simulation and Performance Optimization?
Until now, there has not been a clear way for facilities to connect what is happening at a granular level to what’s happening in their overall system. How does every data point or field activity ultimately contribute to the reliability of the facility? Reliability simulation allows facilities to simulate any task ranging from changes in condition monitoring locations (CML) optimization to capital investments, and understand the impact these tasks have on reliability performance by building off of the causal links established with the ARA, LVC, and reliability system model.
In addition to simulation, optimization can be run, outputting a list of specific tasks that need to be performed on specific dates with quantified value on the individual asset and system as a whole. As a result, reliability simulation and optimization can help facilities increase availability, intelligently reduce spending, and strategically re-allocate resources without negatively impacting the facility.
Benefits
Along with equipping facilities with the tools they need to shift from a reactive to a proactive approach to maintenance, reliability simulation helps facilities:
- Understand how every action impacts performance, gains efficiency in data analysis, and models any scenario to understand how each input affects facility output
- Ensure plans are in place to achieve targets, drive measurable improvement in availability, and see a holistic view across all assets without silos
- Enable integrated reliability, identify lost value in spending to ensure the highest return on capital, and connect short-term actions to long-term strategies
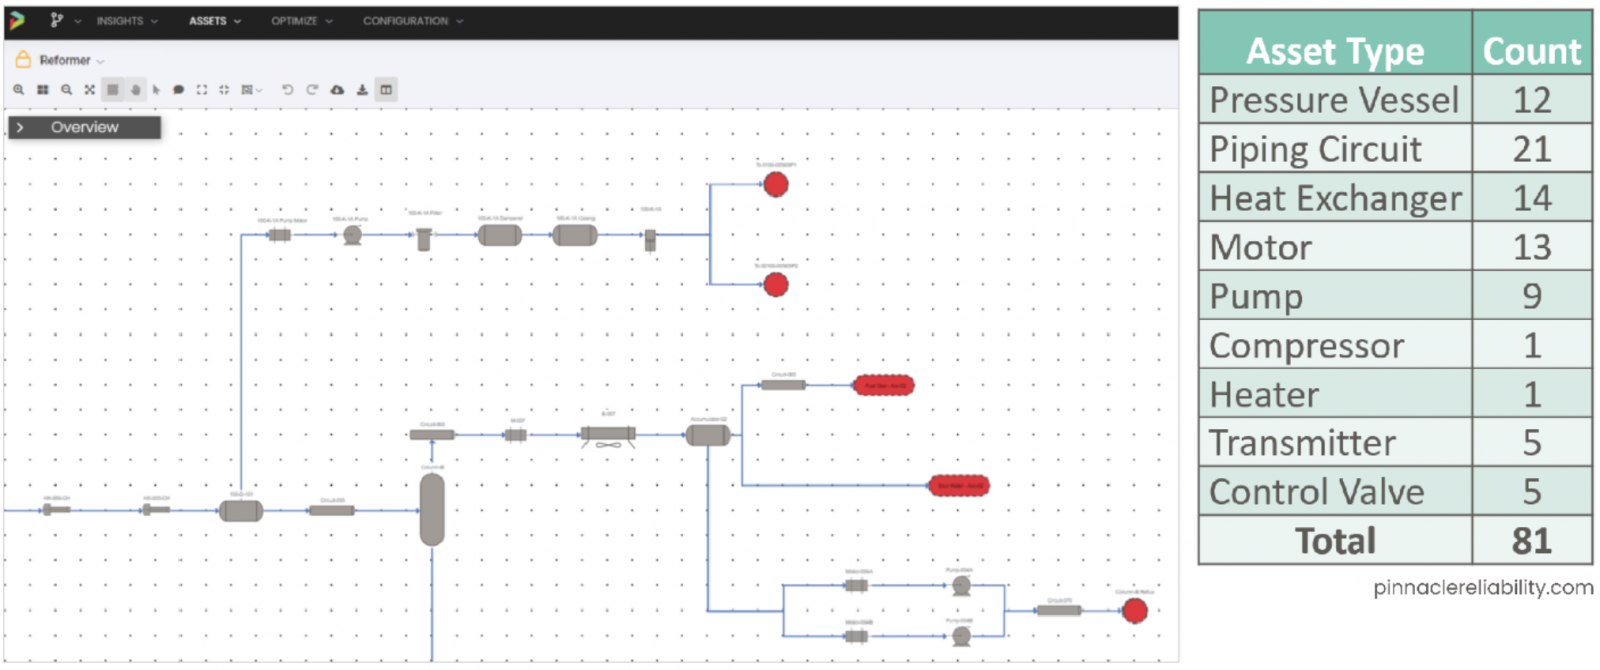
An example of reliability simulation can be applied to the above sub-section of a reformer unit at a top-performing refinery (Figure 1). This sub-section contains 80 assets, both fixed and non-fixed. This facility has best-in-class programs such as risk-based inspection (RBI), integrated operating windows (IOWs), and spare parts optimization. With all of these programs in place, the facility had a projected availability of 96% over the next 10 years with a $1.33 MM spend to maintain that level of availability and manage the health, safety, and environment (HSE) risk for the system.
While the facility already had a strong forecasted availability, QRO helped the facility address how the facility could boost availability without increasing their spending through reliability simulation and performance optimization.
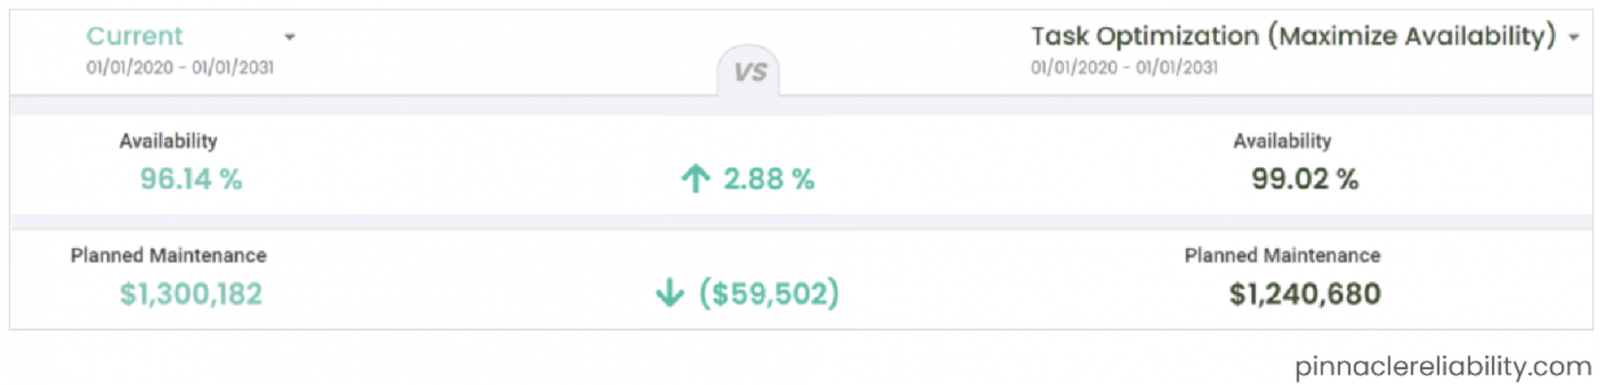
During reliability simulation, the Pinnacle team identified the areas where the facility was collecting data and performing tasks that did not add value to the facility’s system (Figure 2). The output of the simulation provided the facility with a set of specific data-driven tasks and recommendations for their system as a whole. This set included fewer preventative maintenance (PM) tasks and included a recommendation to increase spending in monitoring data such as vibration analysis.
By implementing these tasks, the facility is predicted to increase its availability by 2.88% and decrease its maintenance spending by about $60,000.
Conclusion
Reliability simulation can help facilities achieve the next level of reliability. For more information on reliability simulation or QRO, visit pinnaclereliability.com/solutions/qro.


Comments and Discussion
Add a Comment
Please log in or register to participate in comments and discussions.