If you asked the average reliability leader what the availability of their facility was during the previous one to three years, they would likely have those numbers on quick recall. However, if you asked them their availability in the next one to three years, that’s a much more difficult question to answer. With all the investments in various reliability and maintenance activities and models, it’s still very difficult to forecast what actual downtime risks exist looking forward and what impact that will have on production. As a result, facilities are uncertain on how their maintenance and reliability plans will help them get to their availability and production targets.
While collecting more data may seem like the solution, the key to successfully forecasting system availability is building a strong program based on the data your facility already has. This can be accomplished through the first two elements of Quantitative Reliability Optimization (QRO): an Asset Risk Analysis (ARA) and a Lifetime Variability Curve (LVC).
QRO is a new dynamic reliability approach that bridges existing first-principle based reliability models with advanced data science principles, and system-based optimization to drive improved facility performance strategically balancing availability, process safety, and spending performance.
There are four elements of QRO:
- Asset Risks Analysis (ARA)
- Lifetime Variability Curve (LVC)
- Forecasting System Availability
- Reliability Simulation and Performance Optimization
In the previous blog, Combining 1st Principles and Data Science to Drive Reliability Performance: Quantitative Reliability Optimization (QRO), we reviewed how an ARA creates a causal link between assets' functions, failure modes, and failure mechanisms, as well as how a LVC predicts asset failure using advanced statistical analysis. Still, the challenge that many facilities face is determining how these individual pieces relate to overall performance.
What is Forecasting System Availability?
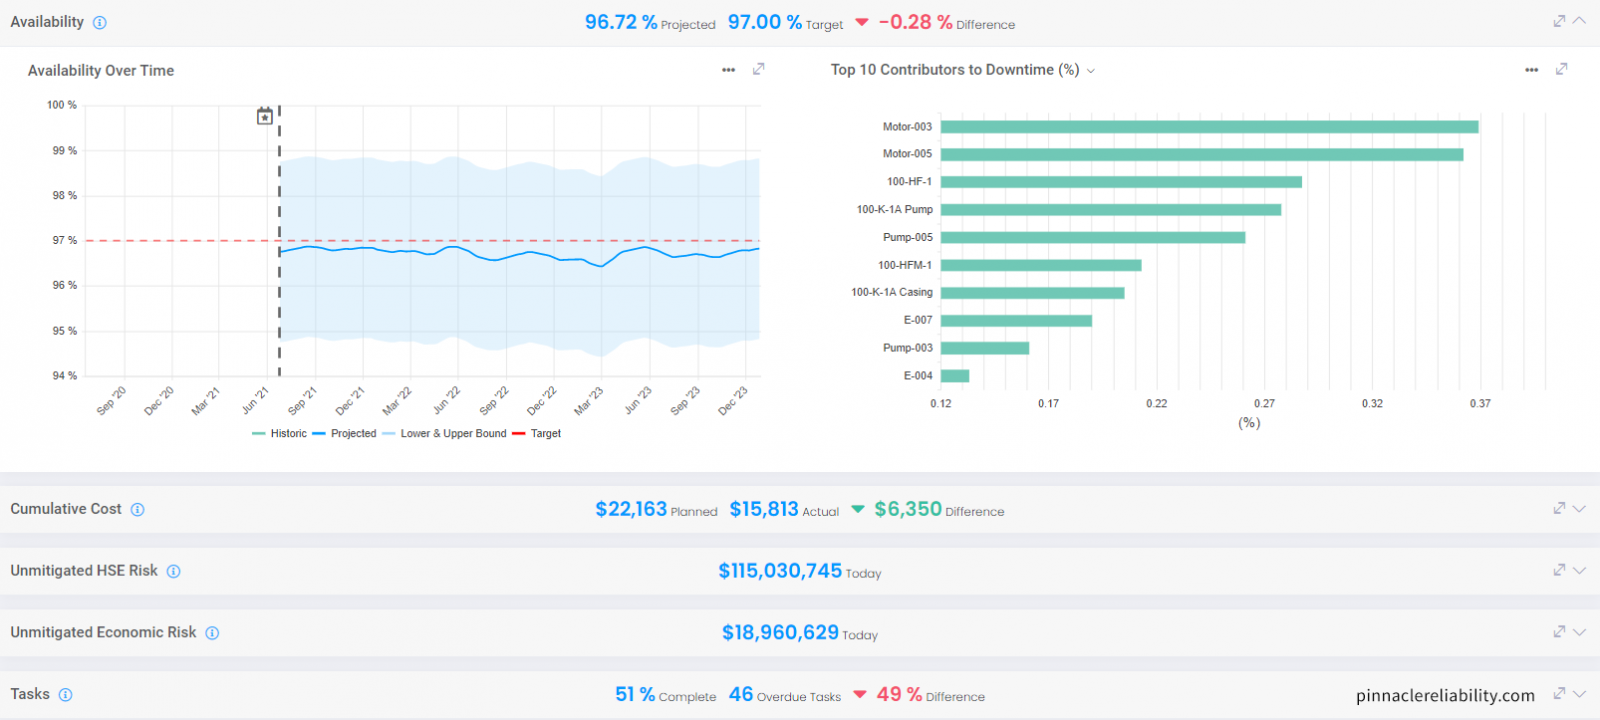
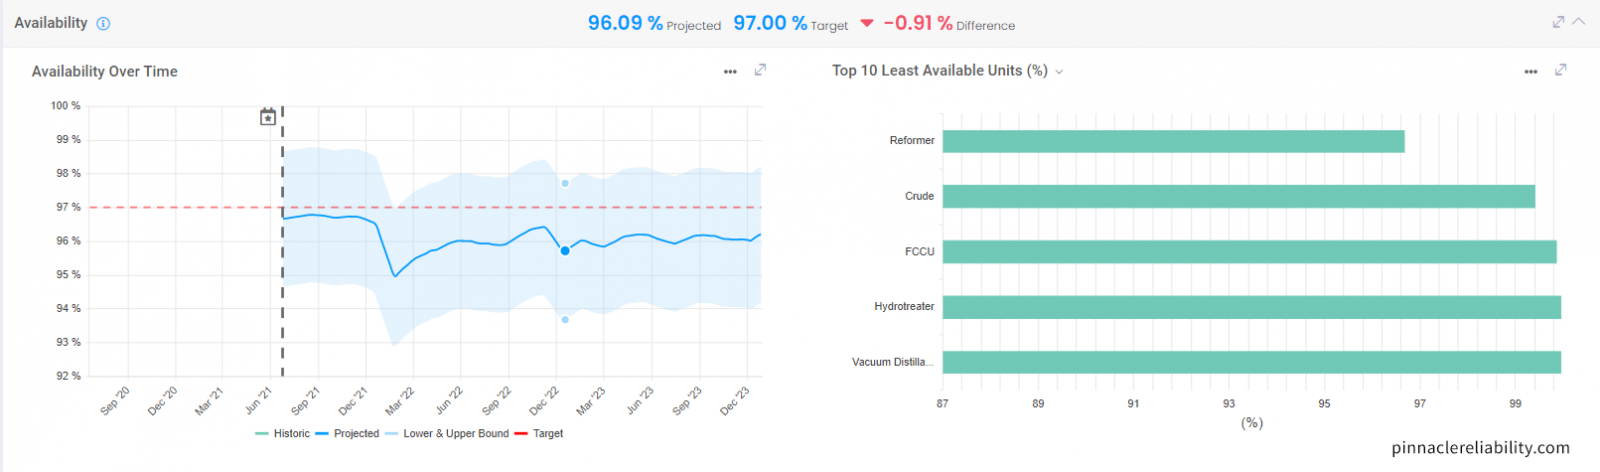
Forecasting system availability starts by connecting the first two elements of QRO – the first principles analysis from ARA and quantitative data from the LVC – and forecasts when a facility’s assets will fail and how their performance will change over time. Next, the reliability relationships between assets are mapped, enabling quantitative measurement of how every asset impacts facility availability over time. This allows the facility to identify which assets are going to drive facility downtime in the near future, enabling better prioritization of limited resources and justification spend. Additionally, this level of system connectivity gives operators the ability to adjust reliability and maintenance plans as new data points are collected.
How Does Forecasting System Availability with QRO Differ from Common Models?
Today, the most common way to approach facility performance is through a Reliability Availability Maintainability (RAM) model. These models provide for reliability simulation, typically in the design phase, and can forecast statistical bands of availability into the future. However, these models have a few limitations, one of which is that the mean time between failures (MTBF) assumptions are not related to actual data or activities in the facility. As a result, the RAM model is typically abandoned after design is complete, immediately outdating the model.
QRO solves both these problems by linking the ARA and LVC functionality to an overall system model that reflects the facility configuration. Additionally, QRO forecasts system availability by:
- Modeling system reliability configuration, including system redundancy, bypasses, slowdowns, and other operations parameters
- Prioritizing tasks and activities that will have the greatest impact on facility performance
- Understanding reliability vulnerabilities and forecasting facility performance based on real-time data
Conclusion
Being able to relate current data and planned activities to a forecasted facility availability is critical to leveraging data to improve reliability. Made possible by Asset Risk Analysis (ARA) and the Lifetime Variability Curve (LVC), the final step in moving the reliability digital twin forward is using this model to drive reliability performance by adjusting operational strategy, updating design, and optimizing inspection and maintenance activities. This can be achieved through reliability simulation and performance optimization, the final element of QRO. For more information on the elements of QRO and how you can apply them to your facility, review Pinnacle’s QRO video series.


Comments and Discussion
Add a Comment
Please log in or register to participate in comments and discussions.