This post is the last in a series about Risk Basked Inspection (though, of course, this will not be the last time I discuss RBI). The earlier posts were on reasons for RBI, defining risk, and on managing risk. In this post, I want to talk about uncertainty, risk thresholds, and damage factor targets.
Setting risk thresholds begins with first determining your current risk. You can identify current risk by running an RBI analysis. The results of your first RBI analysis should include credits for past inspections and will be indicative of past and current practices and, in turn, will provide you with your current risk.
Next we will calculate the resulting risk by implementing the inspection strategies as if you were running a traditional API 510 or API 570 program, and not an RBI-based program. The resulting risk will be projected at the end of the next turnaround cycle. I suggest you also assemble all of the cost data associated with your current, traditional practices/program as projected over the next turnaround period, for the sake of this example we will use four years. To reiterate, the cost data and inspection strategies should come from your current program, not using RBI.
For this comparison example, we must assume that the inspection findings from the analysis after those four years do not yield many, if any, surprises. In other words, assume the results are as they would be at the end of the four-year period. Now compare the results from this analysis to your current risks, which were found after running your first RBI analysis. Did the overall risk go up or down?
At this stage, for comparison, you may also want to normalize the RBI risk output with your corporate risk matrix. This may be due to a desire to use your corporate guidelines as your risk target or threshold or at least understand how they relate to one another.
You now have the information needed to establish risk thresholds, but I would suggest not stopping here. There is still more to learn prior to making a decision.
Are you happy with your current level of risk, or do you want to incrementally drive it downward? Hopefully this exercise will have exposed any areas of vulnerability that were not evident before performing the risk analysis.
If your approach contains metrics that are similar to API RP 581 ($$/year or sq. ft. of risk/year), you can derive further value from RBI process and technology. The extra value comes from applying RBI recommendations to the previous model, instead of your “traditional” approach and comparing the RBI results to those of the traditional strategy. One can then compare the costs versus the units of risk reduction for any case or the entire program. See figure below.
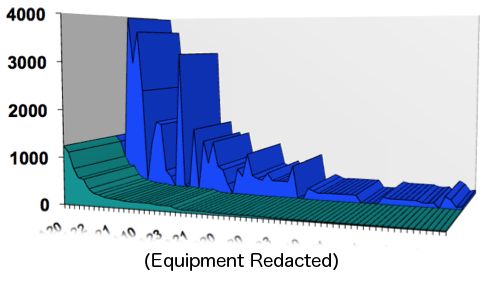
RBI vs. Traditional Inspection Plan -- This figure represents the risk profile of 220 pieces of equipment in a refinery processing unit over a 4 year period. The blue curve represents the risk profile of the equipment with a traditional API 510/570 inspection program implemented. Note the abrupt peaks. These are areas of vulnerability that would not have been managed properly. The green curve represents the risk profile for the same equipment with an inspection program based on API RBI RP 581 over the same period of time. The relative metric used to produce the comparison is risk in square feet per year. There was no additional cost incurred to implement the RBI program and risk was substantially reduced over a four year period. These leading indicators show that implementation of the RBI strategy would drive the risk down for this unit. The RBI analysis also pointed out the high risk equipment that had not been identified as such before and clearly indicated the risk drivers for mitigation and provided the metrics to evaluate options for risk management.
Now that you have the RBI and traditional inspection program risk results, you should compare the risk differences. In API RBI the risk metric is expressed in either risk in square feet (or meters) per year for a unit (see figure above) for each piece of equipment or component, or it may be expressed in dollars per year. Compare this amount to the amount of money it takes to implement the traditional inspection strategies/program. This comparison will yield a percentage of risk reduction per dollar spent for your program and equipment strategies.
You can always post questions or feedback to our LinkedIn Discussion Group. You can also sign up for our email newsletter, Inspectioneering Turnaround, for a weekly dose of AIM intelligence.


Comments and Discussion
There are no comments yet.
Add a Comment
Please log in or register to participate in comments and discussions.